Master Market Geometry with the New Murrey Math Levels Indicator
In the pursuit of consistent trading results, many market participants struggle with identifying precise Support And Resistance zones. While traditional horizontal levels are subjective, the New Murrey Math Levels Indicator provides a mathematical framework based on the legendary principles of W.D. Gann. By dividing Price Action into harmonic octaves, this indicator offers a highly objective way to predict where price will reverse, consolidate, or accelerate.
What are Murrey Math Levels?
Murrey Math is a trading system based on the observation that markets behave in a rhythmic, fractal manner. The system assumes that all price movement is linked to squares of 8. The New Murrey Math Levels Indicator automates this complex geometry for the MetaTrader platform, drawing eight primary horizontal lines on your chart. Each level (from 0/8 to 8/8) has a specific personality and predictive quality.
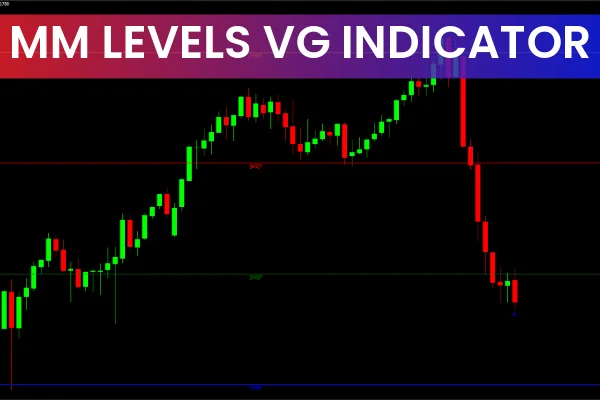
As seen in the EURNZD M1 chart, these levels act as a roadmap. When price reaches a specific "octave" level, the indicator signals whether the market is likely overextended or if a breakout is about to gain momentum.
Understanding the Key Levels
The New Murrey Math Levels Indicator provides traders with clear, actionable zones:
- 8/8 and 0/8 (Ultimate Resistance/Support): These are the most powerful levels. Price rarely breaks through them on the first attempt and often undergoes a significant reversal when they are touched.
- 4/8 (Major Support/Resistance): This is the center point of the harmonic scale. It acts as a massive "pivot" line. If price is above it, the bias is bullish; below it, the bias is bearish.
- 1/8 and 7/8 (Weak Support/Resistance): These levels represent points where a trend might stall briefly before continuing its path.
- 3/8 and 5/8 (The Trading Range): A large percentage of price action happens between these two levels. If price breaks out of this zone, a major trend is usually starting.
Why Use the New Murrey Math Levels?
The primary advantage of the New Murrey Math Levels Indicator is the removal of human emotion. Instead of "guessing" where a trend might end, you are looking at mathematically calculated zones of interest.
- Objective Decision Making: The levels are fixed based on price geometry, ensuring that every trader using the tool sees the same critical zones.
- Versatility: Whether you are Scalping the 1-minute chart (like the EURNZD example) or swing trading on the Daily timeframe, the math scales perfectly to the current volatility.
- Confluence: This indicator works exceptionally well when paired with oscillators. A Murrey 8/8 touch combined with an overbought RSI signal provides a high-probability reversal setup.
- Automatic Calculation: The "New" version of this indicator automatically adjusts as price moves into new ranges, ensuring your levels are always relevant to the current Market Structure.
Conclusion
The New Murrey Math Levels Indicator is more than just a support and resistance tool; it is a complete lens through which to view market psychology and geometry. By understanding the "rhythm" of the octaves, you can position yourself ahead of major market turns and trade with the confidence of mathematical precision.
2 Downloads
Last Update:
Apr 25, 2026 22:44 PM
Published:
Feb 02, 2026 13:28 PM
Category: