Master Market Cycles with the Best RBCI Indicator
In the pursuit of trading excellence, many market participants find themselves trapped by lagging indicators that react only after a significant move has occurred. To gain a true edge in the Forex and CFD markets, professional traders turn to digital signal processing (DSP) to identify the underlying cycles of Price Action. The Range Bound Channel Index (RBCI) is a premier example of this technology, offering a sophisticated way to filter out market noise and focus on actionable trend reversals.
What is the RBCI Indicator?
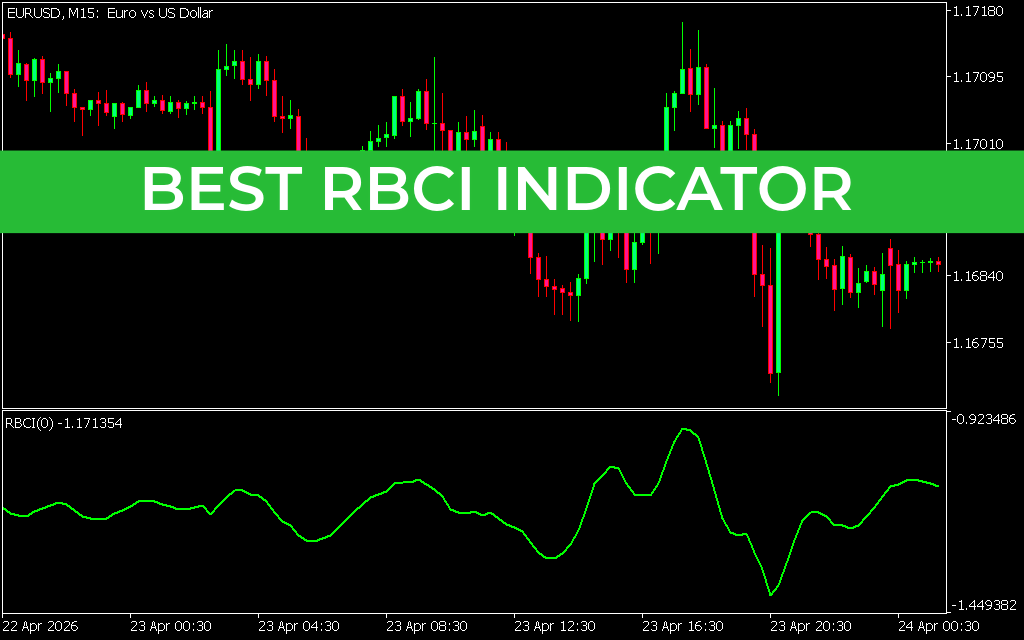
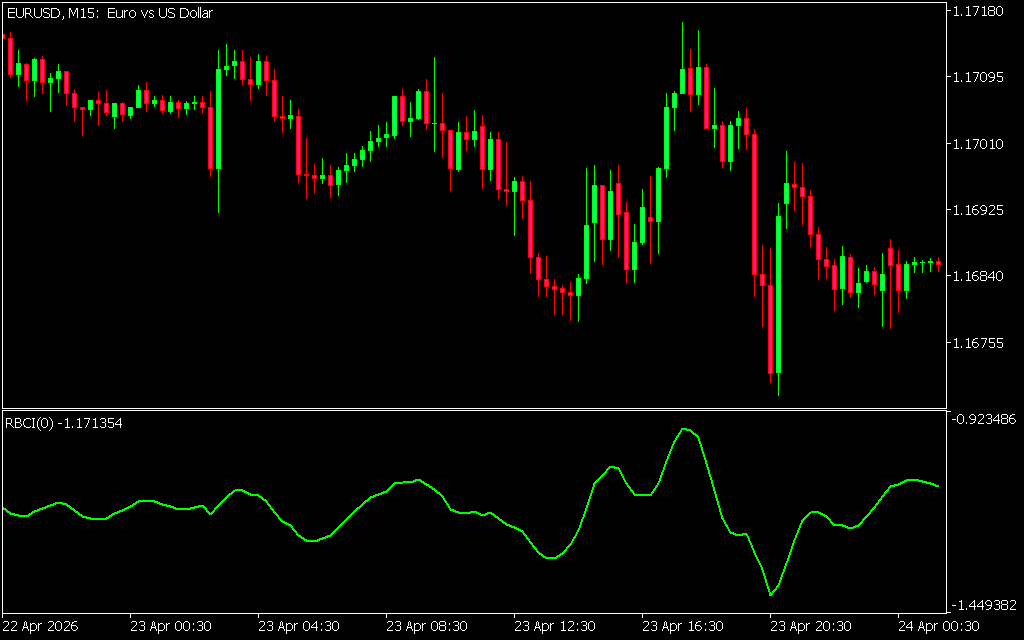
The RBCI (Range Bound Channel Index) is a specialized technical indicator for the MetaTrader platform that utilizes a band-pass filter to extract price cycles. Unlike a standard moving average that simply smooths data, the RBCI is designed to eliminate both low-frequency trend components and high-frequency "noise." What remains is the "cyclical" component of the market—the rhythmic expansion and contraction of price.
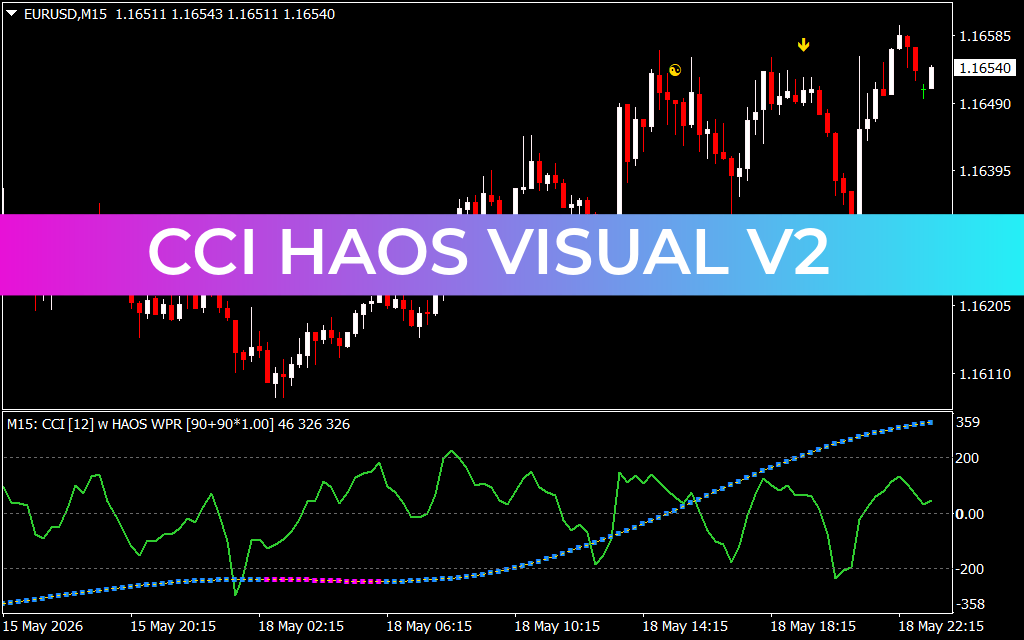
As shown in the EURUSD M15 chart, the indicator appears as a smooth green oscillating line in a sub-window. It is designed to stay within a specific range, highlighting when the market is reaching a cyclical extreme.
The Science of Digital Signal Processing (DSP)
The "Best" RBCI Indicator stands out because of its mathematical foundation. By treating price data as a signal, it can identify the specific frequencies of market movement.
- Trend Filtering: It removes the long-term trend, allowing you to see the individual swings within that trend.
- Noise Reduction: It ignores the minor price jitters that often trigger false signals in less advanced oscillators.
- Cycle Identification: It highlights the "harmonic" nature of the market, making it much easier to predict where a price retracement might end.
Strategic Advantages for Modern Traders
The RBCI Indicator provides several unique benefits that standard indicators simply cannot match:
- Early Reversal Detection: Because the RBCI focuses on cycles, it often peaks or bottoms ahead of the actual price action. This "leading" quality gives traders the chance to prepare for a reversal before it happens.
- Overbought and Oversold Precision: When the green line reaches its upper or lower bounds, it indicates that the current market cycle is overextended. Pairing this with price action (like a pin bar or engulfing candle) creates a high-probability entry signal.
- Divergence Analysis: One of the most powerful ways to use the RBCI is by spotting divergences. If price makes a new high but the RBCI makes a lower high, it signals a massive loss in cyclical momentum, warning you to exit long positions or look for a short entry.
- Market Timing: The RBCI helps you avoid the "choppiness" of a flat market. When the indicator is moving sharply, it signals that a cycle is active and tradeable. When it remains near the zero line, it suggests a lack of momentum.
Conclusion
The RBCI Indicator is an essential tool for any trader who values technical precision over guesswork. By applying digital signal processing to your charts, you gain a clearer view of market cycles and a more objective way to time your entries and exits. Whether you are Scalping intraday moves or swing trading the higher timeframes, the RBCI provides the mathematical clarity needed to stay ahead of the curve.
1 Download
Last Update:
Apr 26, 2026 01:34 AM
Published:
Feb 02, 2026 13:07 PM
Category: