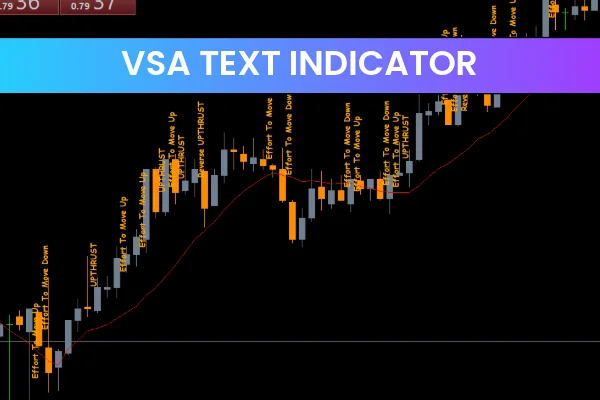
The VSA Text Indicator for MT5 is a spread-based indicator that calculates market volume. VSA stands for Volume Spread Analysis.
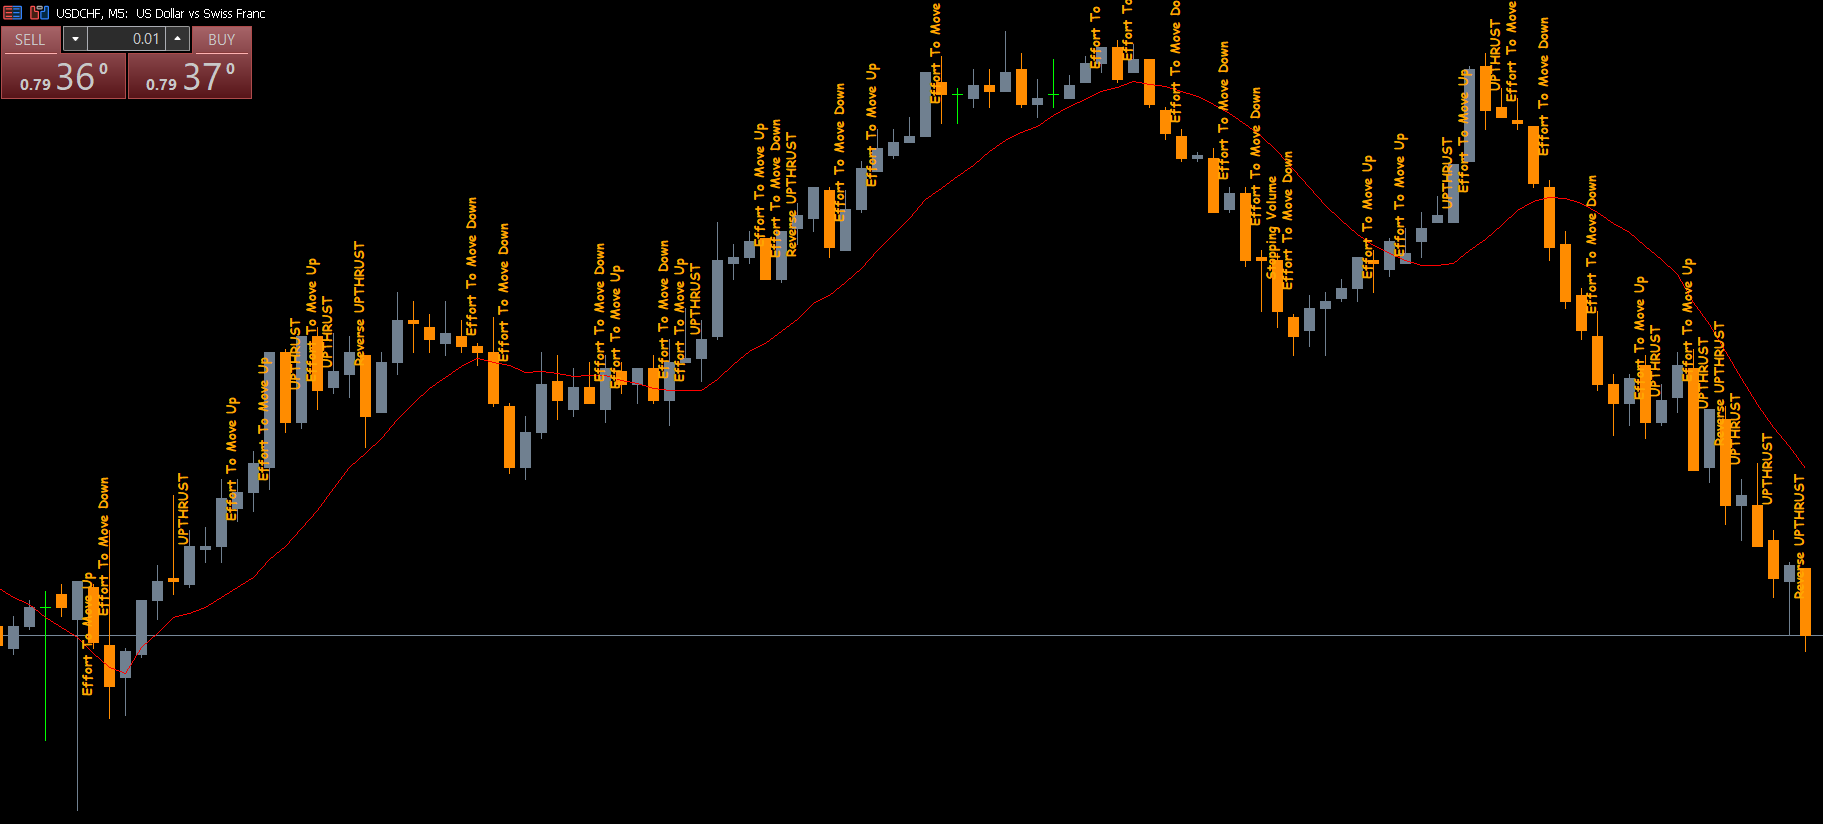
The name “VSA Text” comes from the fact that it shows vertical text where market volume is high or low. It consists of five text signals: no supply bar, no demand bar, force to move up, force to move down, upthrust reversal, and stop volume.
Understanding VSA Text Signals
The “no supply bar” shows when sellers are reluctant to enter the market. The “no demand bar” shows when buyers are hesitant to act.
The “effort to move the bar up” draws a candle moving up, while the “effort to push the bar down” results in a down candle.
The “upthrust bar” indicates a potential uptrend, while an inverse upthrust suggests a potential reversal.
“Stopping volume” indicates little to no volume in the market. The indicator works on the relationship between price and volume and provides insights into potential market direction.
How to Trade with the VSA Text Indicator
By displaying text on the chart, the VSA Text Indicator highlights potential market movements, emphasizing Supply And Demand zones.
When a no-supply bar appears, it signals a potential downtrend. Conversely, a no-demand bar signals a potential uptrend. Uptrend and reverse push bars indicate possible upward or downward movements, allowing traders to see the overall market picture and position themselves accordingly.
Efforts to push the bar up or down reinforce the upthrust and reverse up bars. These bars reflect the general mood of the market, especially when unexpected moves occur.
Traders can also use the VSA Text Indicator alongside other technical analysis tools, such as Support And Resistance levels, to confirm signals. It works on any timeframe as it is based on volume analysis.
Configuring the VSA Text Buy Indicator
The VSA Text Indicator is simple to configure and can be adapted to any trading strategy. Adjusting the settings according to market conditions helps improve trade accuracy and risk management.
FAQ
2 Downloads
Published:
Nov 17, 2025 02:54 AM
Category: