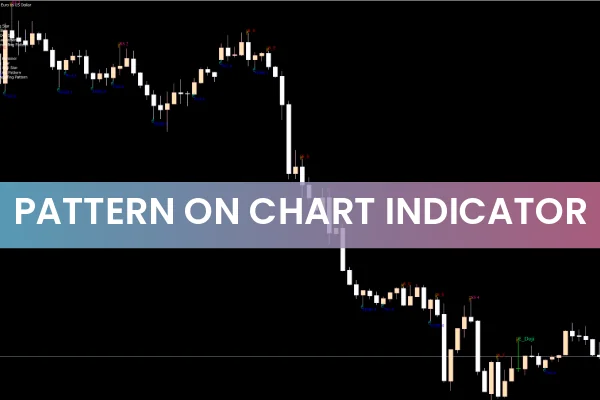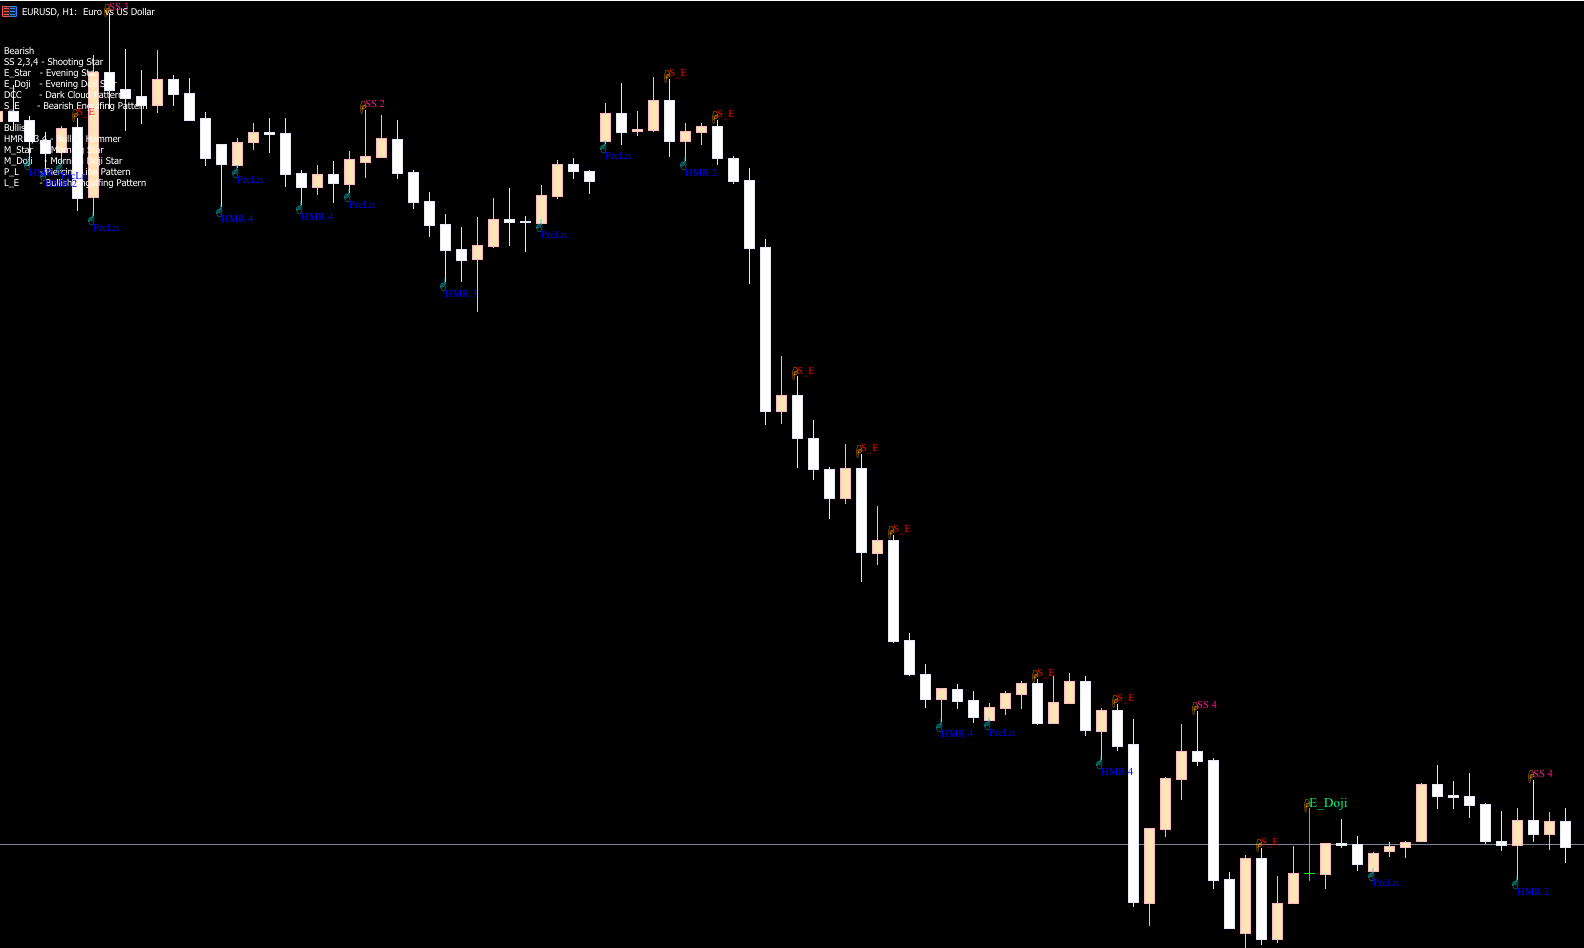
The Patterns On Chart indicator is a powerful MT5 tool designed to help traders, especially beginners, understand candlestick structures and market behavior. By automatically detecting price patterns, this indicator saves time and reduces the need to memorize dozens of candlestick formations. With Patterns On Chart, you can quickly analyze high-low, open-close prices, and market sentiment to make informed trading decisions.

How the Patterns On Chart Indicator Works
Candlestick charts are widely used in financial markets to display price movements over time. Each candlestick reflects the market’s mood and can indicate potential reversals or trend continuation. The Patterns On Chart indicator scans the last 200 bars after each candle closes, highlighting possible candlestick patterns. This feature ensures traders stay updated with market trends without manually identifying patterns.
Benefits of Using Patterns On Chart in MT5
Automatic Pattern Detection: No need to memorize complex candlestick names.
Market Sentiment Insight: Quickly assess bullish or bearish trends.
Time Efficiency: Focus on strategy instead of chart scanning.
Beginner-Friendly: Simplifies technical analysis for new traders.
How to Use Patterns On Chart Effectively
Combine with Trend Indicators – While the indicator identifies candlestick patterns, combining it with tools like moving averages can improve trading accuracy. For instance, adding a 10-day simple moving average helps determine buy or sell opportunities aligned with the market trend.
Identify Counter Signals – The indicator also highlights patterns against the trend, such as bearish engulfing patterns at resistance levels, allowing traders to anticipate reversals.
Trade Confirmation – Patterns On Chart works best when used alongside other technical tools and risk management strategies.
Trading Example Using Patterns On Chart
On a USD/JPY daily chart, a bullish candlestick pattern above the 10-SMA can indicate a potential upward move. Traders can enter buy positions aligned with the trend, increasing the probability of success. Conversely, if a bearish pattern appears near a resistance level, it can signal a potential reversal and an opportunity to sell.
Why Traders Choose Patterns On Chart
Candlestick charts are favored over line and bar charts because they provide a clear visual representation of price action. The Patterns On Chart indicator simplifies this process, making it easier for traders to spot profitable setups and make data-driven decisions.
Conclusion & Call-to-Action
The Patterns On Chart indicator is a must-have for any MT5 trader seeking to understand market trends and make accurate trading decisions. Apply it today on your MT5 platform and experience the benefits of automated candlestick analysis. Visit IndicatorForest.com to download the indicator and access advanced trading tools.
Published:
Nov 13, 2025 23:26 PM
Category: