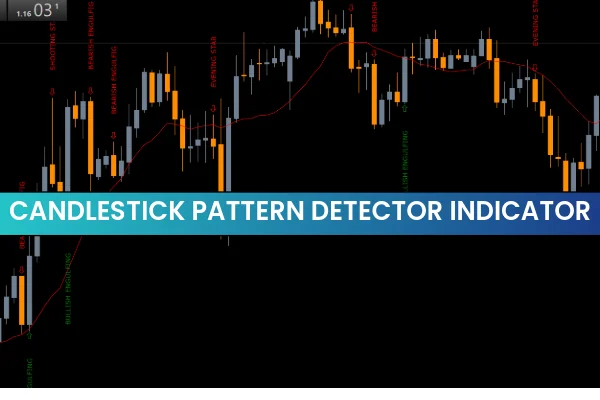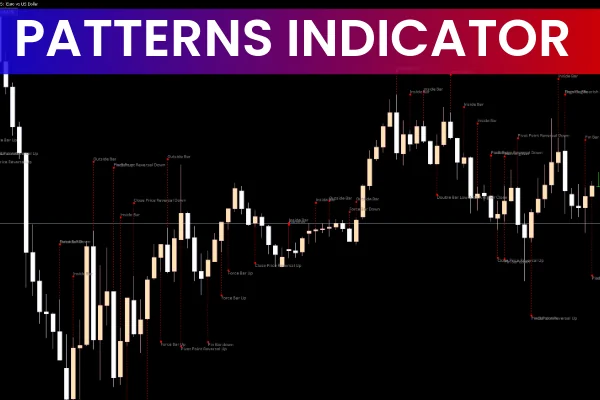
The Patterns Indicator for MT5 is an advanced candlestick recognition tool that automatically scans the chart for powerful reversal and continuation patterns. Instead of manually identifying complex price formations, this indicator highlights them visually—helping traders make more informed decisions with less effort. It recognizes major patterns such as bullish/bearish engulfing, dark cloud cover, three black crows, three white soldiers, stars, harami formations, piercing line, and many others.
Because these patterns reveal market sentiment shifts, the Patterns Indicator is invaluable for Scalping, intraday trading, and swing trading alike.
Candlestick Patterns Detected by the Patterns Indicator
Engulfing Patterns (Bullish & Bearish)
Bullish engulfing:
Occurs when a small bearish candle is followed by a larger bullish candle that completely engulfs the previous bar. It signals a possible bullish reversal.
Bearish engulfing:
This happens when a small bullish candle is followed by a strong bearish candle engulfing the prior candle—indicating bearish reversal pressure.
Dark Cloud Cover Pattern
A bearish reversal pattern where a bullish candle is followed by a bearish candle opening above the previous close but ending below the midpoint of the bullish candle. This often marks exhaustion in an uptrend.
Three Black Crows
A strong continuation pattern consisting of three long bearish candles, each closing near the low. It shows intense selling pressure and often continues a downtrend.
Piercing Line Pattern
A two-candle reversal where a bearish candle is followed by a bullish candle that opens lower but closes above the midpoint of the previous body. It signals a potential uptrend reversal or pause in downward movement.
Three White Soldiers
The opposite of the three black crows. This pattern includes three consecutive long bullish candles, each closing near its high. It signals strong bullish continuation.
Additional Pattern Types Identified
Three Outside/Inside Up Patterns
These occur when three consecutive candles close either above the previous candle’s high (outside up) or below the previous low (inside up). They hint at Trend Reversal or momentum shift.
Three Inner/Outer Descending Patterns
Three candles appear inside the range of a larger previous candle. This indicates potential reversal as market pressure begins to weaken.
Star Patterns
A star forms when a small candle gaps away from a large previous candle. This suggests hesitation and possibly a trend reversal, depending on its location (morning star, evening star variants).
Harami Patterns
A classic reversal pattern where a small candle forms completely within the body of a larger prior candle. It signifies indecision and upcoming trend change.
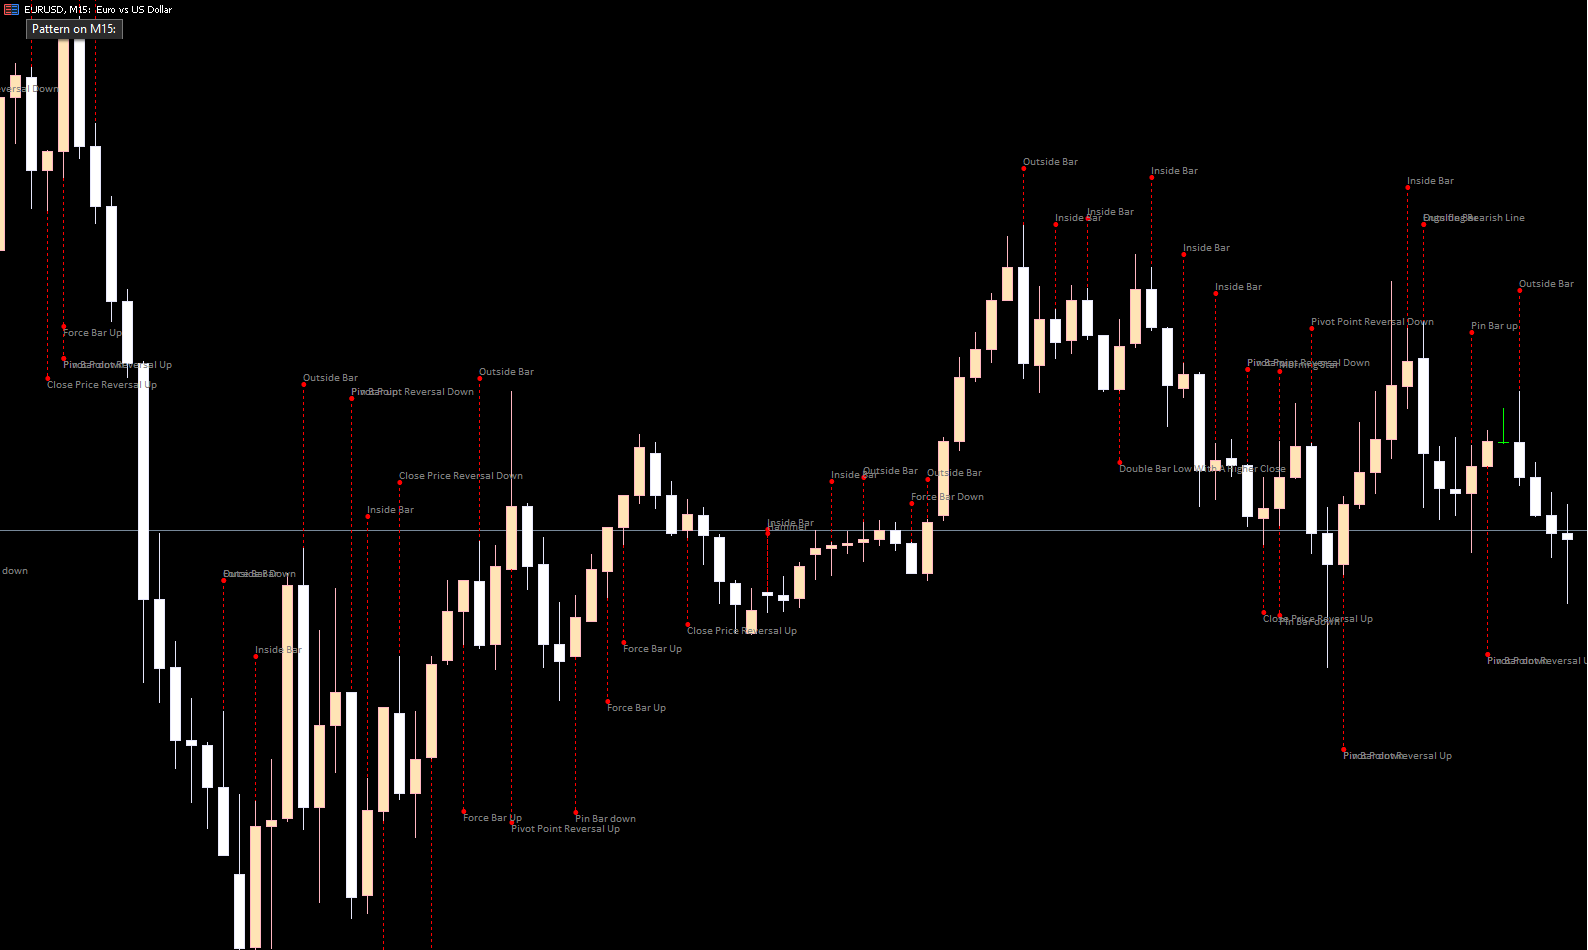
How to Use the Patterns Indicator on MT5
Identify Reversal Zones
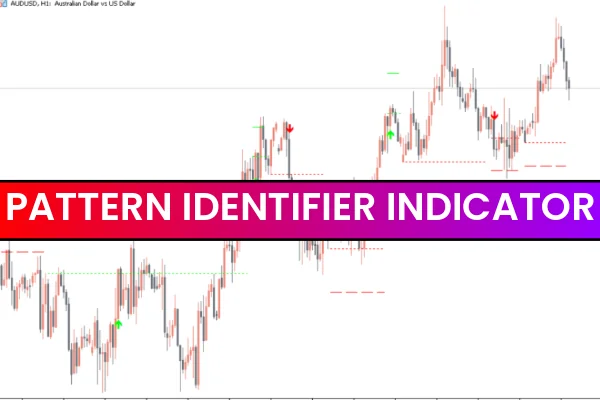
The Patterns Indicator automatically marks reversal zones by drawing symbols at each candlestick pattern. When a bullish pattern appears at support, or a bearish pattern forms at resistance, the reversal probability increases significantly.
Confirm Trend Continuation
Patterns like three black crows or three white soldiers show momentum strength. Traders can use these signals to enter on pullbacks or add to winning positions.
Combine With Other Tools
While the Patterns Indicator is powerful, it performs best when used alongside:
RSI or Stochastic Oscillator
Volume indicators
EMAs
Price Action confirmation
This enhances accuracy and reduces false pattern interpretation during consolidation.
Multi-Timeframe Usage
The indicator works across M1 to D1 charts, allowing traders to detect micro-patterns for scalping or broader formations for swing trades.
Conclusion
The Patterns Indicator for MT5 provides a comprehensive way to identify both trend reversals and continuation signals by automatically marking essential candlestick formations. Thanks to its clarity and broad pattern coverage, traders can quickly spot market shifts and improve trade timing.
To download additional premium indicators or explore advanced trading tools, visit IndicatorForest.com.
FAQ
12 Downloads
Published:
Nov 17, 2025 11:02 AM
Category: