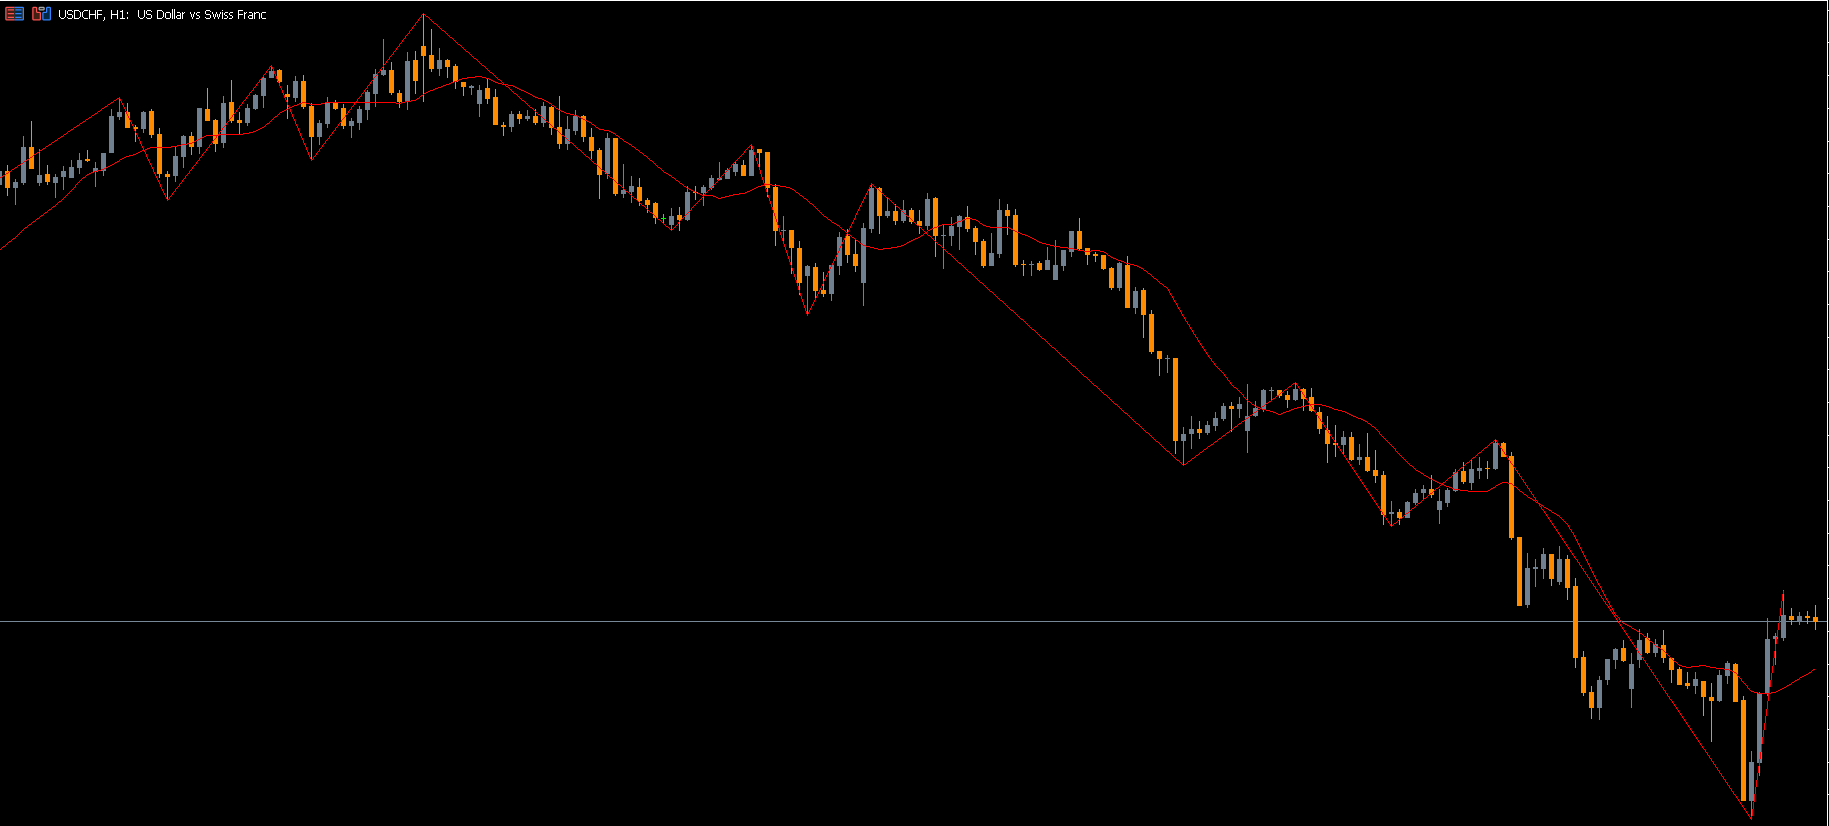
The Mtf ZigZag Indicator analyzes price behavior and draws lines that connect significant highs and lows—essentially mapping out selling waves and rally waves. These swing points form a clean and continuous structure that helps traders understand the real movement of the market.
Filtering Out Market Noise
Forex markets often experience sharp fluctuations caused by high trading activity, robots, and automated advisors (EAs). These chaotic moves create what traders refer to as market noise, which can make it difficult to spot real trends.
The Mtf ZigZag Indicator solves this by filtering insignificant moves, leaving behind only valid price swings.
How It Works
The indicator determines swing points using parameters such as:
ExtDeviation – Sensitivity to price deviations
ExtDepth – Minimum distance between swing points
ExtBackStep – Number of bars to confirm a swing
These settings allow the indicator to adapt to different market conditions and timeframes.
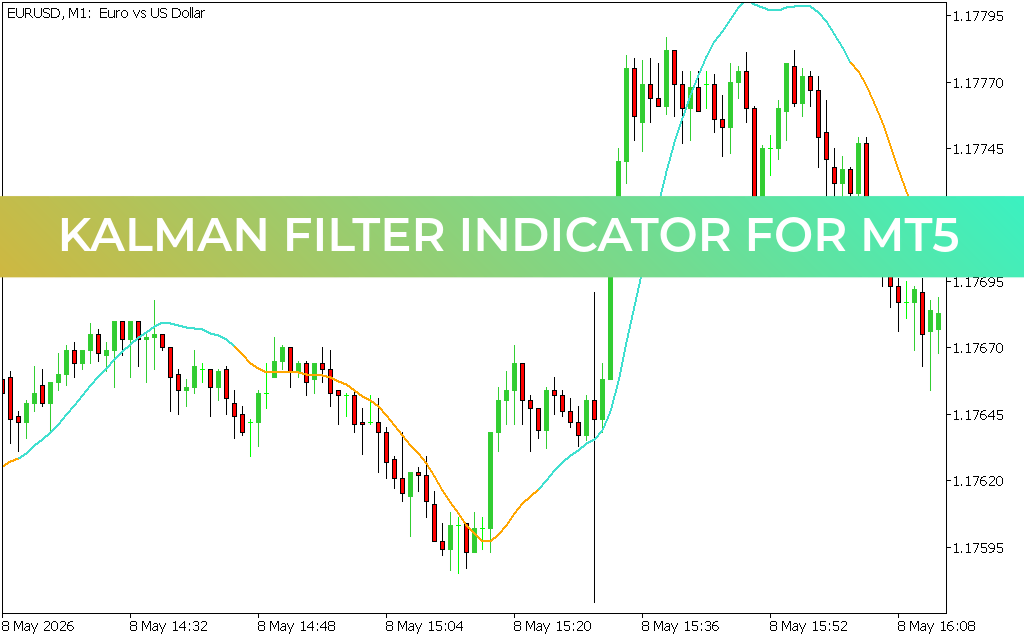
Visually, the indicator appears as a single, clear line connecting major extreme points. Because it is multi-timeframe (MTF), traders can use it to see higher-timeframe structure on lower charts—an advantage for identifying the dominant trend.
How to Use the Mtf ZigZag Indicator
Although the indicator does not provide direct buy or sell signals, it is extremely valuable for several core trading tasks:
Identifying Support and Resistance Levels
Support And Resistance levels are essential tools in technical analysis. The Mtf ZigZag Indicator helps identify these zones by marking the highest swing highs (red) and lowest swing lows (blue).
These zones are powerful because:
The more times price reacts to a level, the stronger it becomes.
Higher-timeframe levels carry more weight.
The Mtf ZigZag makes it visually simple to locate these areas and avoid placing trades into major barriers.
If you want to automate this process, try the Support & Resistance Indicator available on IndicatorForest.com.
Drawing Trend Lines
Trend lines help traders understand the direction of the market. Since trends consist of higher highs and higher lows (bullish) or lower highs and lower lows (bearish), the Mtf ZigZag Indicator is the perfect tool to highlight these swing points.
You can manually draw trend lines:
Through higher lows to identify an uptrend
Through lower highs to identify a downtrend
Because the indicator filters out noise, the trend lines you draw are much more accurate and reliable.
For fully automated trend lines, consider using the AutoTrendLines Indicator.
Applying Fibonacci Levels
Fibonacci levels are widely used to predict retracement and extension points. For Fibonacci tools to work correctly, traders must select accurate high and low points. The Mtf ZigZag Indicator makes this process easy by marking clean rally and decline waves.
For example:
Identify a rally wave with ZigZag
Apply Fibonacci retracement
Observe how price reacts around key levels such as 38.2%, 50%, and 61.8%
New traders can also explore the Fiboretracement Indicator to better understand Fibonacci concepts.
Conclusion
The Mtf ZigZag Indicator for MT4 is an essential tool for traders who want to understand true Market Structure without noise. By marking significant swing highs and lows, it helps identify support and resistance, trend direction, and Fibonacci zones. Its multi-timeframe capability enhances accuracy, making it suitable for traders of all experience levels.
To download more advanced and free MT4/MT5 indicators, visit IndicatorForest.com and explore our growing library of technical tools.
FAQ
2 Downloads
Published:
Nov 16, 2025 10:00 AM
Category: