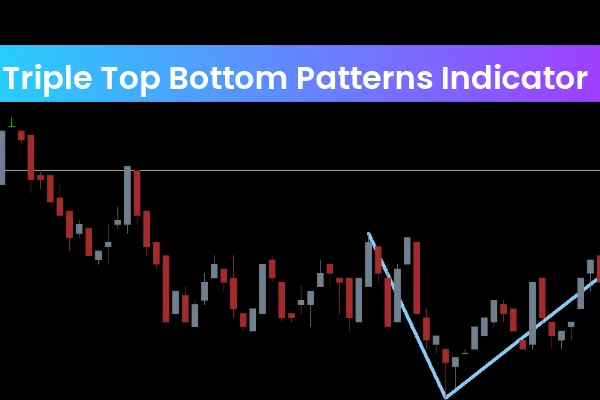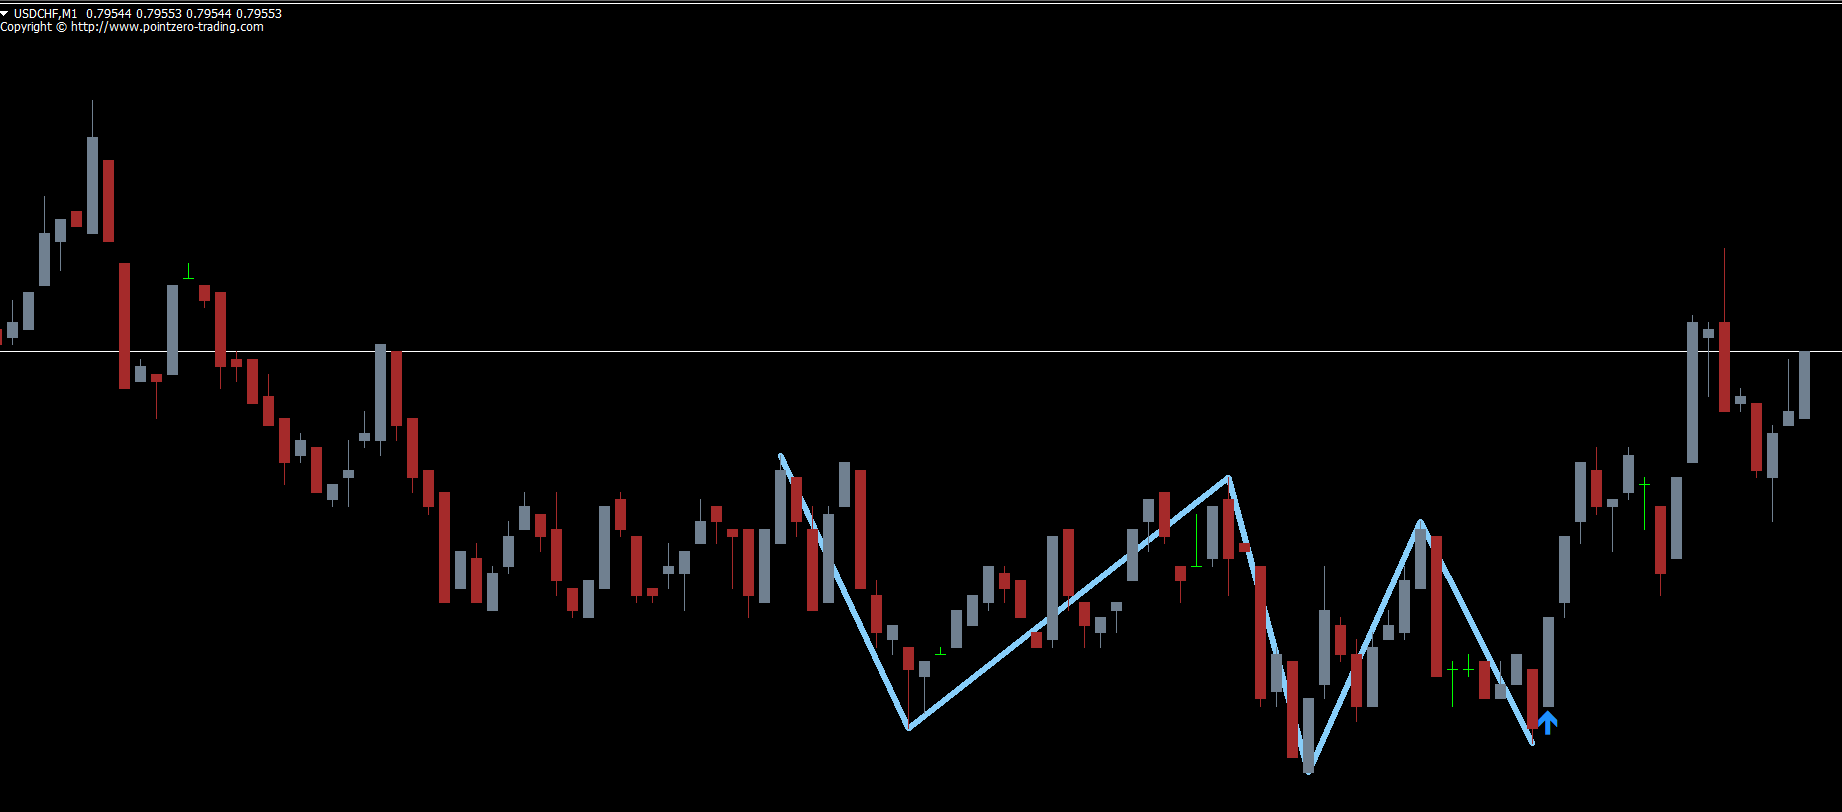
The Triple Top Bottom Patterns Indicator for MT4 is a powerful chart-pattern tool designed to help traders quickly identify potential market reversal zones. By detecting triple tops and triple bottoms, this indicator reveals areas where price has rejected the same level three times, signaling a possible shift in trend direction. Whether you trade forex, indices, or commodities, this indicator simplifies analysis and strengthens decision-making.

A triple top occurs when the price forms three consecutive peaks around the same resistance area, indicating that buyers are losing strength. Conversely, a triple bottom forms three valleys at a similar support level, showing weakening selling pressure.
The Triple Top Bottom Patterns Indicator for MT4 automatically scans the chart, identifies these formations, and marks them visually. This saves traders time and ensures they never miss important reversal signals.
The tool uses historical price data, swing highs, and swing lows to detect repeated rejections at a price range. Once a triple top or triple bottom is confirmed:
A pattern shape is drawn around the three points
An arrow appears to signal potential entry direction
Alerts can be triggered depending on indicator settings
This automation eliminates the need to manually inspect charts for repetitive patterns.
Using the Triple Top Bottom Patterns Indicator for MT4 is simple and beginner-friendly.
When three peaks form at the same resistance zone, the indicator marks the formation and typically prints a downward arrow.
This often suggests a potential sell opportunity, as price is likely to move lower after failing to break resistance.
When three bottoms appear around the same support zone, the indicator prints an upward arrow.
This often indicates a possible buy signal, as price may bounce upward from strong support.
Although the indicator is powerful, combining it with other tools improves accuracy:
Moving Averages
RSI or Stochastic
Support and resistance zones
Trendlines
This helps confirm whether the reversal is strong or weak.
Confirm triple tops or bottoms on higher timeframes (H4 or Daily) for stronger reliability.
A real reversal often comes with decreasing volume during the third touch and strong volume during breakout.
Triple patterns work best in trending or volatile conditions—not in tight ranges.
Automatic pattern detection (no manual drawing required)
Clear buy and sell arrows for quick decisions
Helps identify early reversal points
Works on all forex pairs, indices, commodities, and crypto charts
Beginner-friendly
Lightweight and smooth performance in MT4
The Triple Top Bottom Patterns Indicator for MT4 is an excellent tool for price action traders who rely on reversal patterns for entries. By visually marking triple tops and bottoms, the indicator highlights ideal buying and selling zones so traders can act with confidence.
To download more high-quality MT4/MT5 indicators, visit IndicatorForest.com and explore our growing library of free and premium trading tools.
Published:
Nov 17, 2025 08:05 AM
Category: