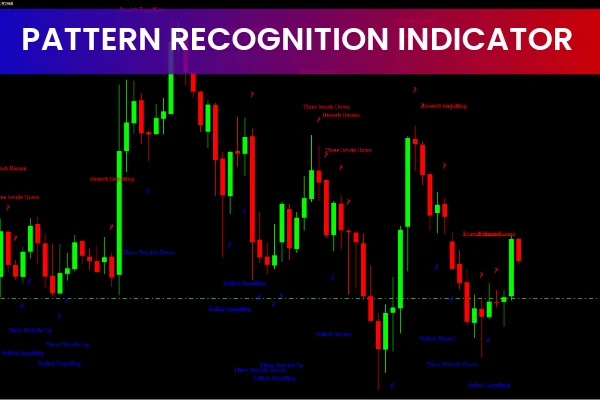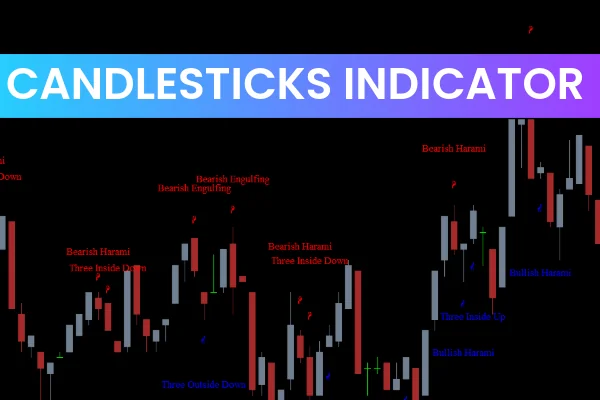
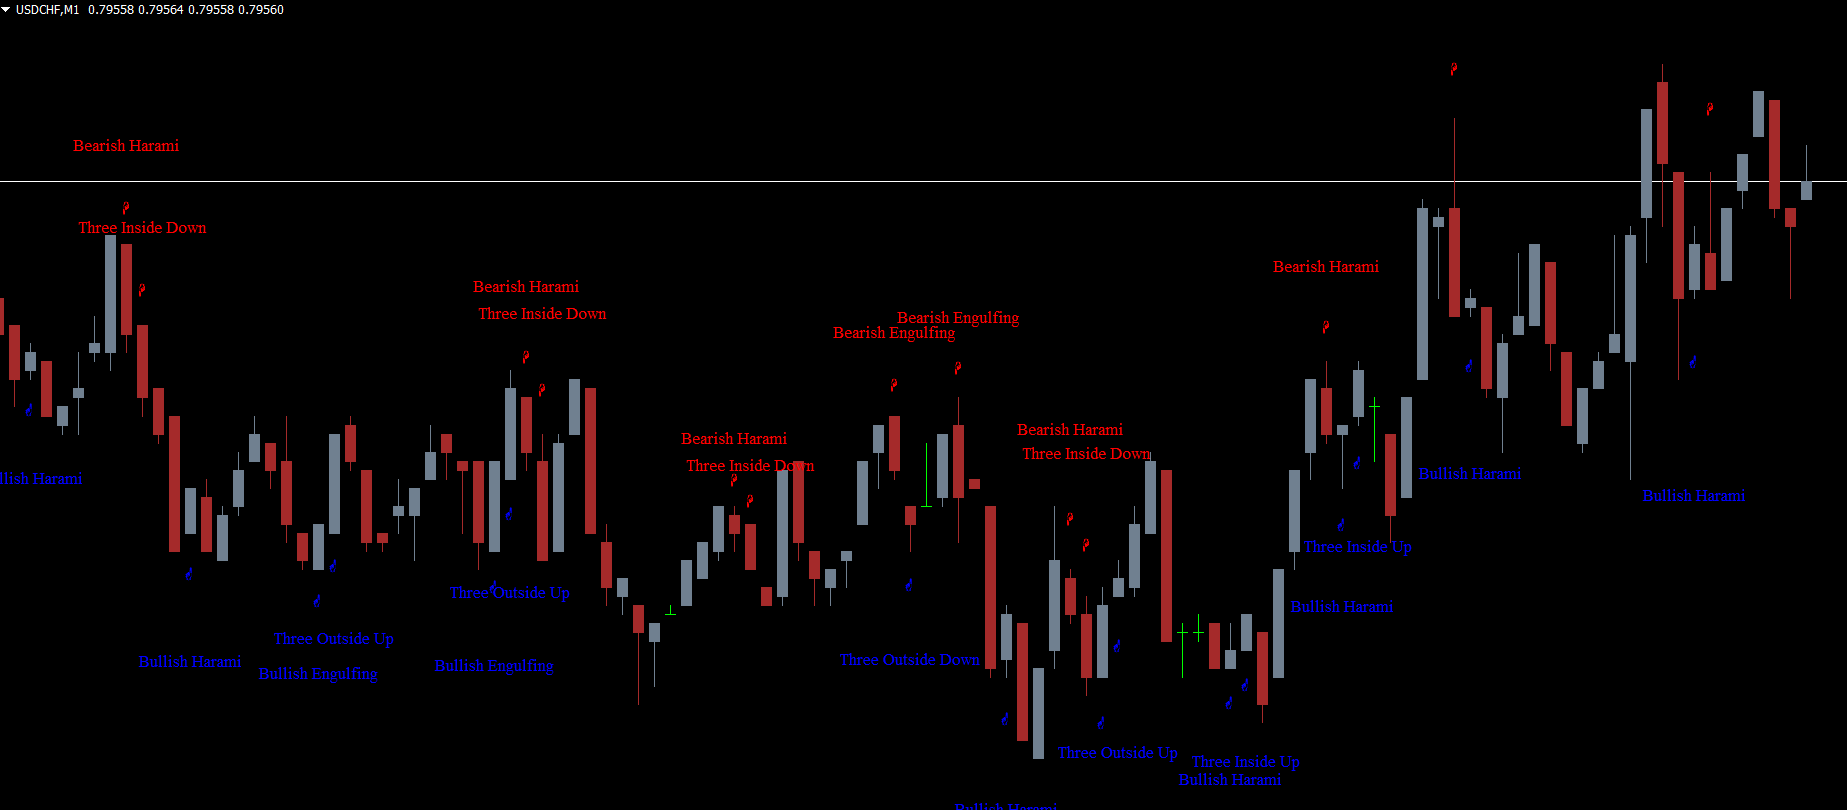
The Candlesticks Indicator for MT4 is a powerful chart-analysis tool that automatically detects major Japanese candlestick patterns to help traders identify Trend Continuation and reversal setups. Instead of manually analyzing each candle, this indicator marks significant formations such as bullish/bearish engulfing, stars, harami, dark cloud cover, three black crows, three white soldiers, and several other high-probability patterns.
For forex traders who rely on Price Action, this indicator provides instant clarity and deeper insight into market sentiment, making it useful in all timeframes—from M1 scalping to daily and weekly swing trading.
What the Candlesticks Indicator for MT4 Shows
The indicator identifies a wide range of candlestick formations, each highlighting potential market shifts. These patterns help traders understand whether a trend is likely to continue or reverse.
Below are the major patterns the indicator plots on the chart:
Bullish Engulfing Pattern
A small bearish candle followed by a larger bullish candle that completely engulfs the previous body.
Signal: Bullish reversal, showing buyers have taken control.
Bearish Engulfing Pattern
A small bullish candle followed by a larger bearish candle engulfing the previous candle.
Signal: Bearish reversal, often appearing at the top of an uptrend.
Dark Cloud Cover
Occurs when a bullish candle is followed by a bearish candle that opens above the previous close but closes below its midpoint.
Signal: Bearish reversal or weakening uptrend momentum.
Three Black Crows
Three consecutive long bearish candles closing near their lows.
Signal: Strong bearish continuation indicating sustained selling pressure.
Three White Soldiers
The opposite of three black crows: three consecutive strong bullish candles.
Signal: Strong bullish continuation and increased buying activity.
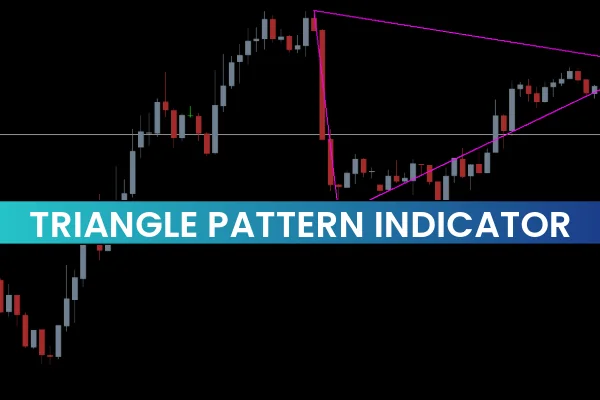
Three Outside/Inside Up Pattern
Three candles that close progressively higher than previous highs (outside up) or remain inside the previous candle’s range (inside up).
Signal: Potential bullish reversal.
Three Inside/Outside Down Pattern
Three candles closing lower or staying within the previous candle’s body.
Signal: Potential bearish reversal.
Piercing Line Pattern
A bearish candle followed by a bullish candle that opens below the previous low but closes above its midpoint.
Signal: Bullish reversal or correction in a downtrend.
Stars (Morning Star, Evening Star Variants)
A small candle that gaps away from the prior candle, creating a star formation.
Signal: Market indecision, followed by potential Trend Reversal once confirmation appears.
Harami Pattern
A small candle completely contained within the previous large candle’s body.
Signal: Trend reversal or a pause during ongoing momentum.
How to Use the Candlesticks Indicator for MT4
Identify Reversals
Patterns like engulfing, harami, piercing line, stars, and three black crows/soldiers help traders spot trend reversals early. These are ideal for traders looking to catch turning points.
Confirm Trend Continuation
Patterns such as three white soldiers or three black crows strengthen the direction of the current trend, allowing safer entries in trending markets.
Combine with Other Tools
For higher accuracy, combine candlestick patterns with:
Support And Resistance levels
Trendlines
RSI or Stochastic oscillator
Volume analysis
This increases the probability of successful trades.
Perfect for Multi-Timeframe Analysis
The indicator works on all currency pairs and timeframes. Whether trading H4 for swing entries or M5 for scalping, the candlestick signals remain consistent and reliable.
Conclusion
The Candlesticks Indicator for MT4 is an essential tool for traders who rely on price action. By automatically detecting dozens of high-value candlestick patterns, the indicator simplifies decision-making and provides clear insights into trend reversals or continuation signals.
To download more advanced MT4/MT5 indicators and trading tools, visit IndicatorForest.com.
FAQ
4 Downloads
Published:
Nov 17, 2025 08:29 AM
Category: