The Harmonik Manual Indicator for MT4 is a powerful technical analysis tool that identifies Harmonic patterns based on Fibonacci ratios. These patterns are built on the concept that history repeats itself, and by applying the Fibonacci sequence (0, 1, 1, 2, 3, 5, …), traders can forecast potential price movements with accuracy.

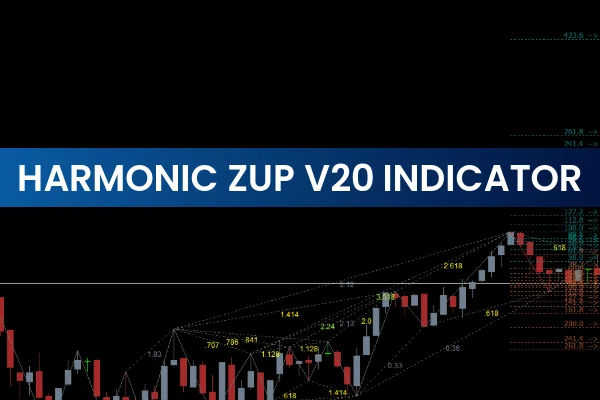
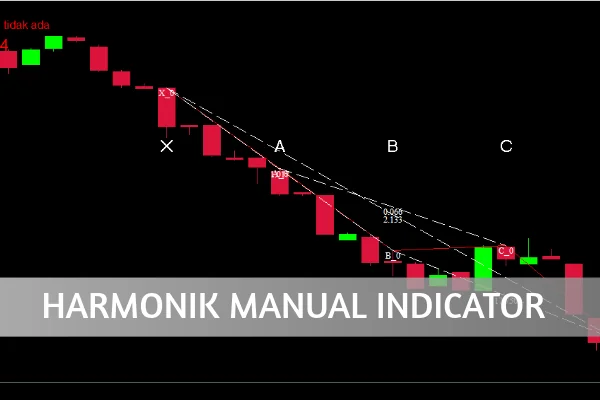
This indicator plots the well-known X, A, B, C, and D points on the chart, helping traders visualize the formation of patterns like Gartley, Bat, Butterfly, and Crab. Though it doesn’t label the exact pattern type, it offers traders a strong foundation to identify price reversals and continuation zones.
How the Harmonik Manual Indicator Works
Understanding Fibonacci in Harmonic Patterns
The Harmonik Manual Indicator MT4 uses Fibonacci retracements and extensions to detect possible reversal zones. By analyzing wave structures between points X, A, B, C, and D, traders can identify potential entry and exit points with remarkable precision.
The indicator also draws additional text on the chart, displaying Fibonacci retracement levels and daily range data, providing an in-depth overview of the market’s current status.
Why Traders Use the Harmonik Manual Indicator
Identifies market turning points with Fibonacci precision.
Compatible with all timeframes, from M1 to D1.
Highlights retracement and extension levels for clear trade setups.
Supports multiple Harmonic patterns, including Gartley, Butterfly, and Crab.
Harmonik Manual Indicator BUY/SELL Signals
To generate effective BUY and SELL signals, traders must first recognize the Harmonic pattern type. The Harmonik Manual Indicator automatically draws the pattern structure but does not name it, leaving the identification step to the trader.
BUY Signal: When point D forms at the bottom of a downtrend, it signals a potential bullish reversal. Traders can enter long trades or exit short positions here.
SELL Signal: When point D appears at the top of an uptrend, it indicates a likely bearish reversal. Traders can enter short trades or close long positions accordingly.
This logical approach allows traders to anticipate market reversals and align their positions with potential Fibonacci-based trend changes.
What Are Harmonic Patterns?
Harmonic patterns are advanced chart formations that utilize Fibonacci ratios to forecast future Price Action. The most recognized types include:
Gartley Pattern
Bat Pattern
Butterfly Pattern
Crab Pattern
Each pattern has unique Fibonacci retracement and extension levels that help traders define precise turning points.
Success Rate of Harmonic Patterns
Studies show that Harmonic patterns can achieve an 80–90% success rate when used correctly. However, accuracy depends on a trader’s ability to correctly identify and confirm the pattern formation.
The Harmonik Manual Indicator simplifies this process by automatically plotting key wave points, allowing traders to focus on strategy confirmation and trade execution rather than manual pattern drawing.
Conclusion
The Harmonik Manual Indicator MT4 is a valuable tool for traders who rely on Fibonacci-based Harmonic analysis. It helps visualize complex wave structures, identify potential reversals at point D, and enhance trading precision.
Whether you’re a beginner or an experienced trader, this indicator can dramatically improve your technical analysis skills.
👉 Download the Harmonik Manual Indicator for free from IndicatorForest.com and start mastering the art of Harmonic trading today.
2 Downloads
Published:
Oct 31, 2025 03:14 AM
Category: