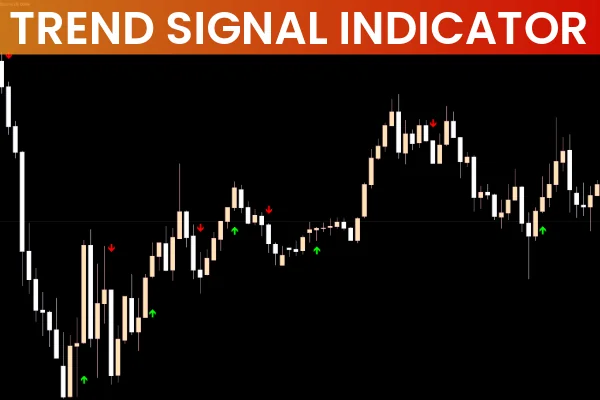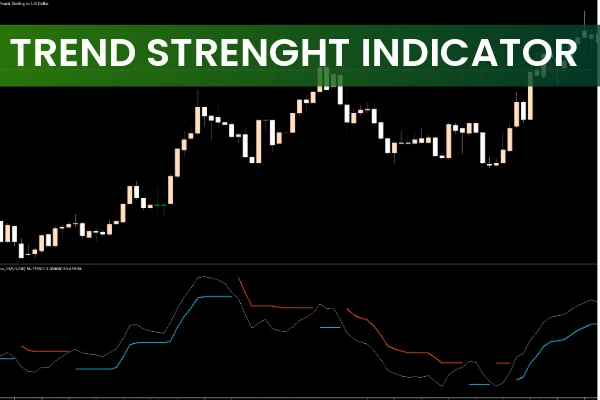
The Trend Strength Indicator for MetaTrader 5 (MT5) is a powerful tool for analyzing the momentum and strength of market trends. By combining algorithms with Average True Range (ATR) and price standard deviation, this indicator provides clear signals about the strength and direction of price movements. Whether you are a beginner or an experienced trader, the Trend Strength Indicator can enhance your trading strategy.
How the Trend Strength Indicator Works
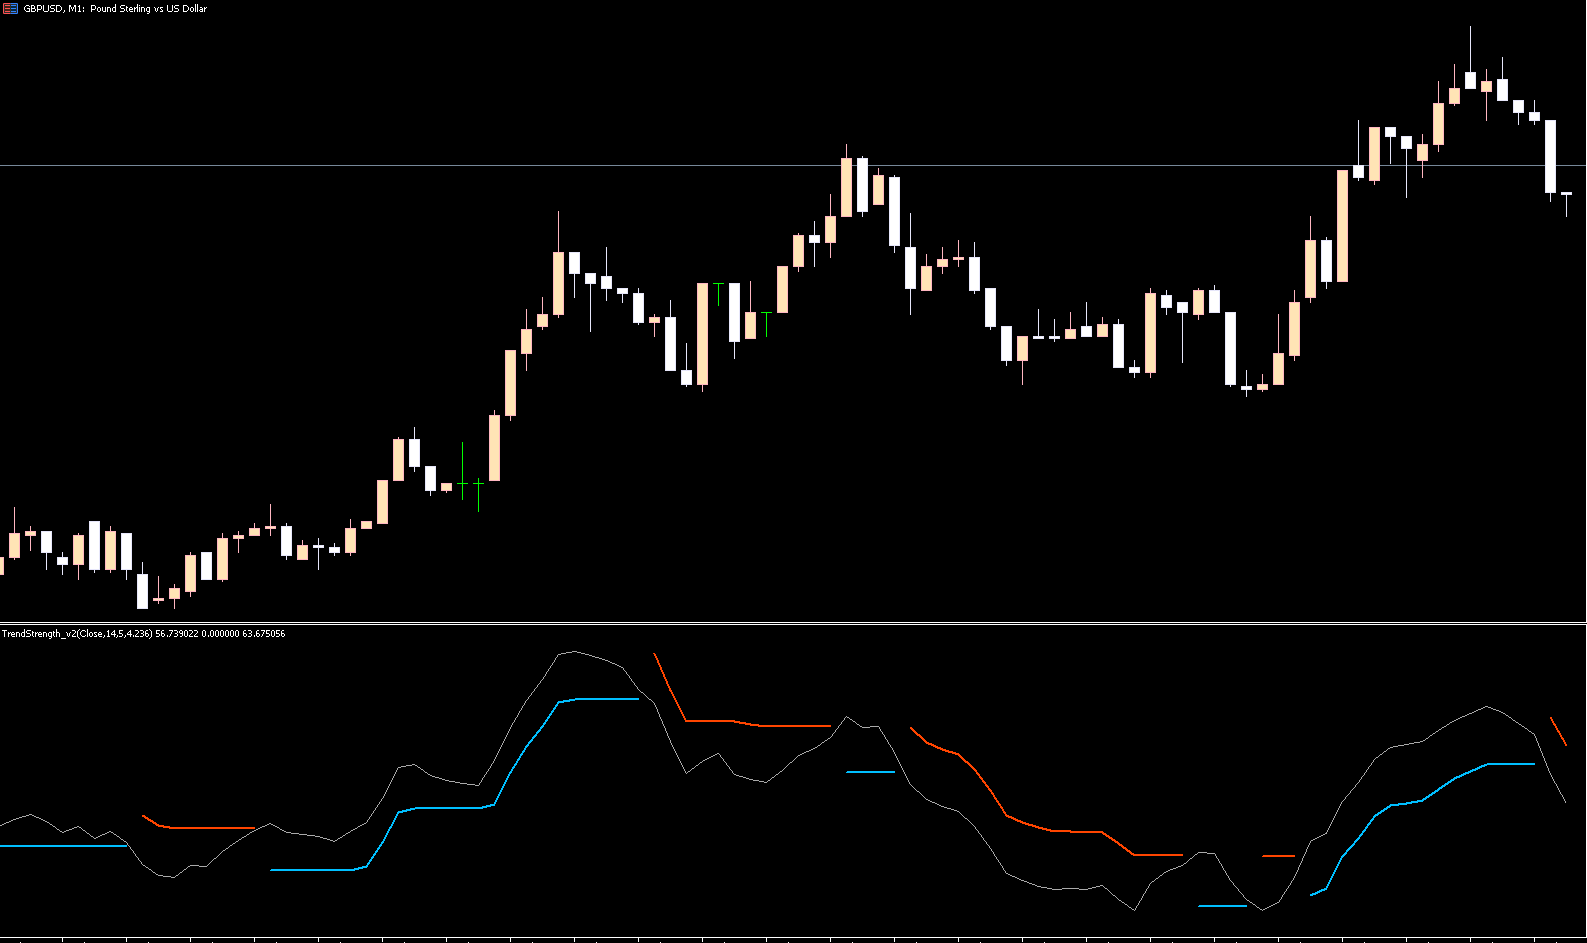
The indicator uses a histogram to display market momentum:
Blue Bars: Represent bullish momentum
Crimson Bars: Represent bearish momentum
The histogram bars fluctuate between positive and negative zones. Bars crossing above the zero line indicate a trending market (bullish or bearish), while bars below zero suggest a sideways or ranging market. This visual representation allows traders to quickly gauge the strength and direction of any traded asset.
Using the Trend Strength Indicator for BUY/SELL Signals
BUY Signal:
Wait for the blue histogram bars to rise above the zero line, indicating bullish strength.
Confirm with Price Action, such as a bullish candlestick pattern (e.g., bullish engulfing).
Enter a long position once conditions are met.
SELL Signal:
Wait for the crimson histogram bars to rise above the zero line, signaling bearish strength.
Confirm with price action, such as a bearish candlestick pattern (e.g., bearish engulfing).
Enter a short position after confirmation.
This combination of trend strength and price action helps traders identify high-probability trade setups for intraday, swing, and Scalping strategies.
Benefits of the Trend Strength Indicator
Measures both trend strength and market condition (trend vs. range)
Provides clear bullish and bearish signals
Suitable for all trader levels: beginner, intermediate, and advanced
Effective for day trading, scalping, and swing trading
Free to download and simple to install on MT5
Call to Action
Enhance your trading strategy with the Trend Strength Indicator for MT5. Download it for free at IndicatorForest.com and start identifying strong trends and profitable entry points today.
FAQ
5 Downloads
Published:
Nov 21, 2025 00:22 AM
Category: