The Liquidity Swings Indicator for MT5 is an analytical tool developed by LuxAlgo to help traders visualize areas where price has historically shown strong activity. These areas often align with points where orders accumulate, volatility increases, or market reactions occur. The indicator automatically identifies swing highs and lows, plots Liquidity Zones, and displays volume labels, giving traders a clearer view of where buying and selling activity has previously been concentrated.
Unlike traditional support and resistance tools, the Liquidity Swings Indicator incorporates liquidity-based logic. This helps traders better understand how price interacts with regions that may reflect heightened interest from larger participants or clusters of orders.
Liquidity Swings Indicator: How the Signals Work
This indicator does not generate conventional entry arrows or strict buy/sell signals. Instead, it focuses on contextual Market Structure, allowing traders to interpret potential reaction points more effectively.
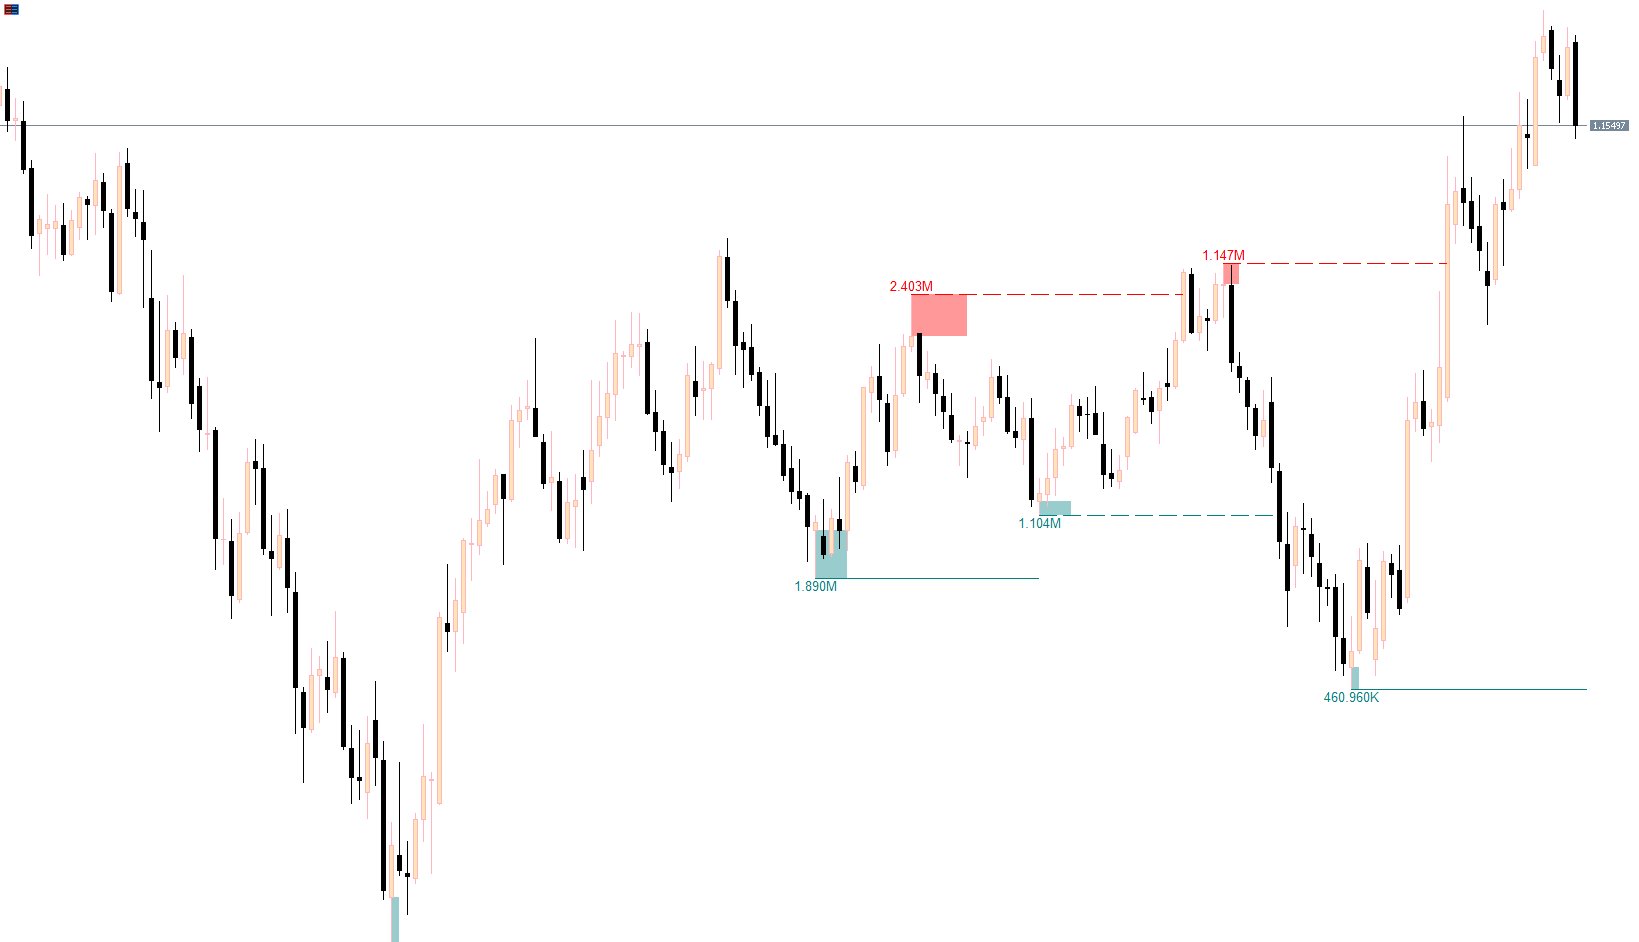
Teal Buy-Side Liquidity Zones
Teal zones plotted beneath candles highlight areas of buy-side liquidity located below swing lows. Traders often observe these areas because they may be retested during:
Pullbacks
Liquidity sweeps
Areas of potential price exhaustion
These zones act as visual markers where price has previously shown interest.
Red Sell-Side Liquidity Zones
Red zones above candles indicate sell-side liquidity around swing highs. When price moves back into these regions, traders may watch for:
Possible rejection
Breakout continuation
Structural shifts in momentum
These zones help emphasize where previous selling interest was concentrated.
Volume Labels
Volume values such as “21.260K” appear near swing points to show how much volume was present at those highs or lows. Higher-volume swings can stand out as more significant, helping traders filter out minor or less impactful structure.
Conclusion
The Liquidity Swings Indicator for MT5 helps traders visualize where notable price activity has taken place, offering a clearer picture of liquidity dynamics and market structure. Whether used for Scalping, day trading, or swing trading, the tool provides context that can assist in planning around potential reversals, continuations, or areas of interest. It serves as a visual guide for analyzing price movement around liquidity without relying on traditional arrow-based signals.
FAQ
82 Downloads
Published:
Nov 17, 2025 01:10 AM
Category: