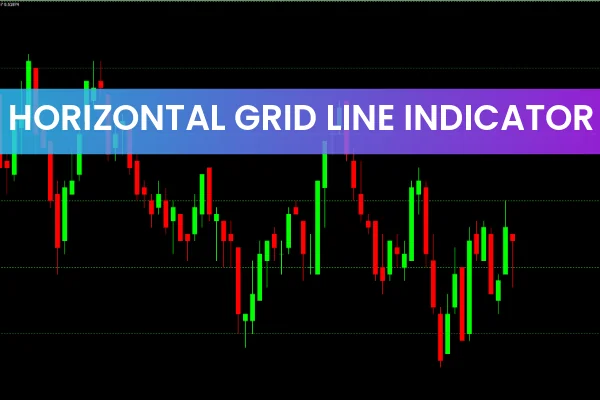
The Horizontal Grid Lines Indicator for MT4 is a simple yet powerful chart-enhancing tool that plots equidistant horizontal levels across your MetaTrader 4 chart. These levels help traders visualize price behavior, reveal hidden support and resistance zones, and pinpoint high-probability trade entries and exits. Although often overlooked by many Forex traders, the Horizontal Grid Lines Indicator provides essential Market Structure information that can significantly improve trade decision-making.
Designed for novice, intermediate, and advanced traders, this indicator helps identify trend reversal zones, potential breakout areas, and psychological price levels that influence market reactions. The tool works on all Forex pairs and all timeframes, making it highly versatile.
How the Horizontal Grid Lines Indicator Works
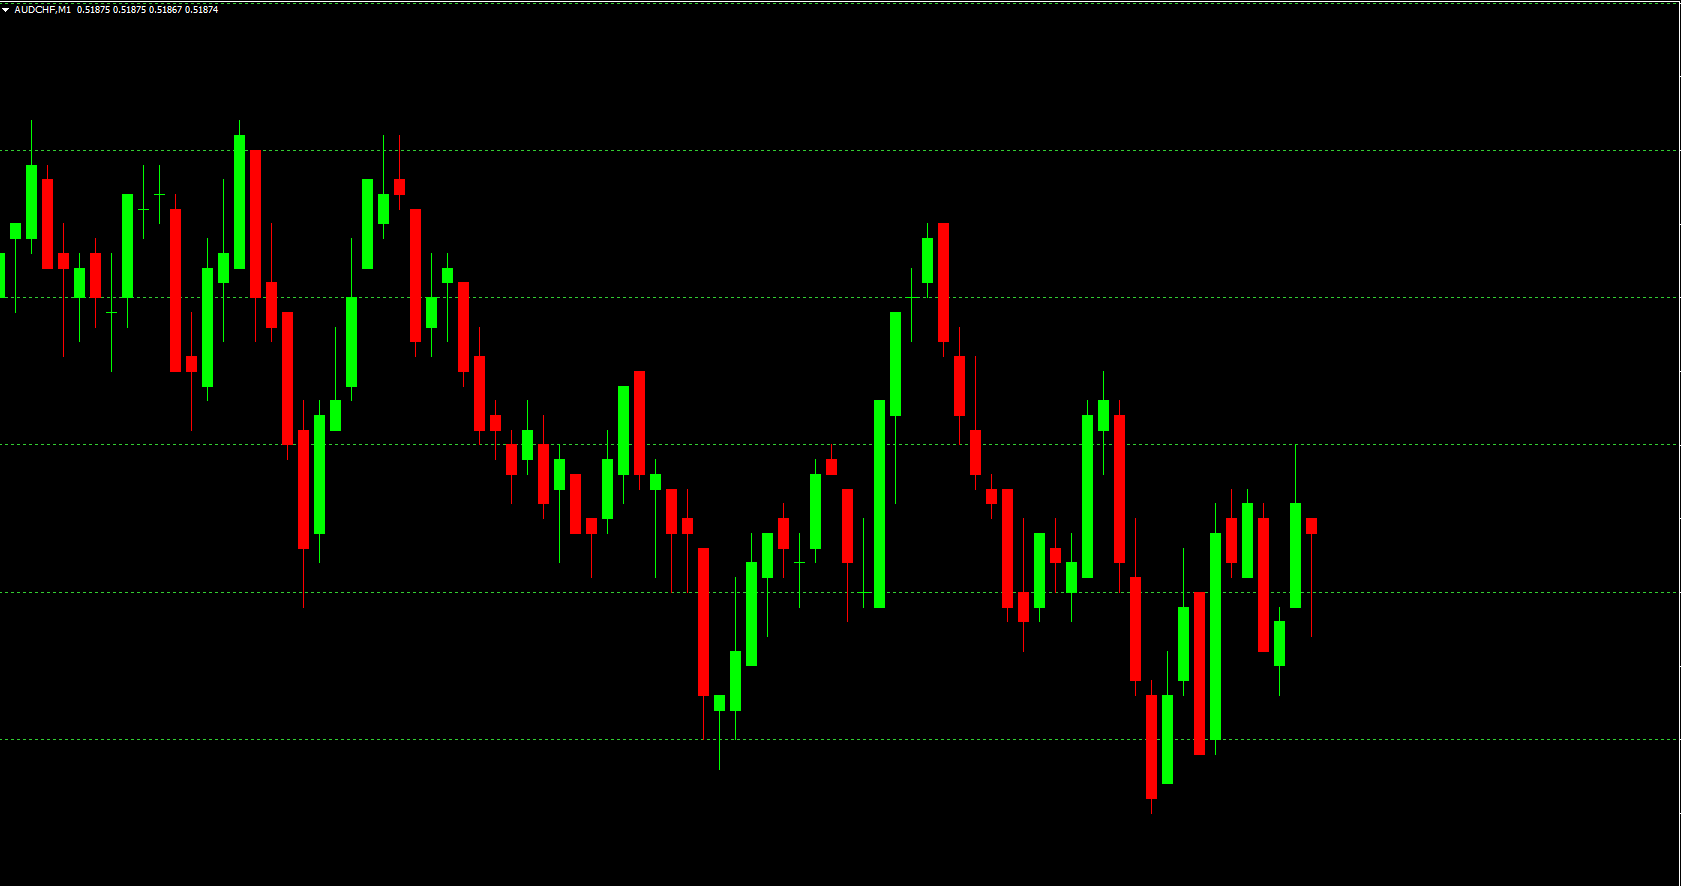
The indicator draws horizontal lines on the chart at equal distances. By default, the grid spacing is set to 200 points (20 pips), but traders can adjust the distance to match their trading preferences.
Key features include:
• Adjustable Grid Spacing
Traders can modify the pip distance between lines depending on volatility, trading style, or timeframe.
• Psychological Price Levels
The green dotted grid line represents the 0.00-level—commonly known as a psychological zone. These levels often act as turning points, where price reacts strongly. Traders frequently use these levels for:
Taking profit
Closing running trades
Trailing stop-losses
Waiting for breakouts
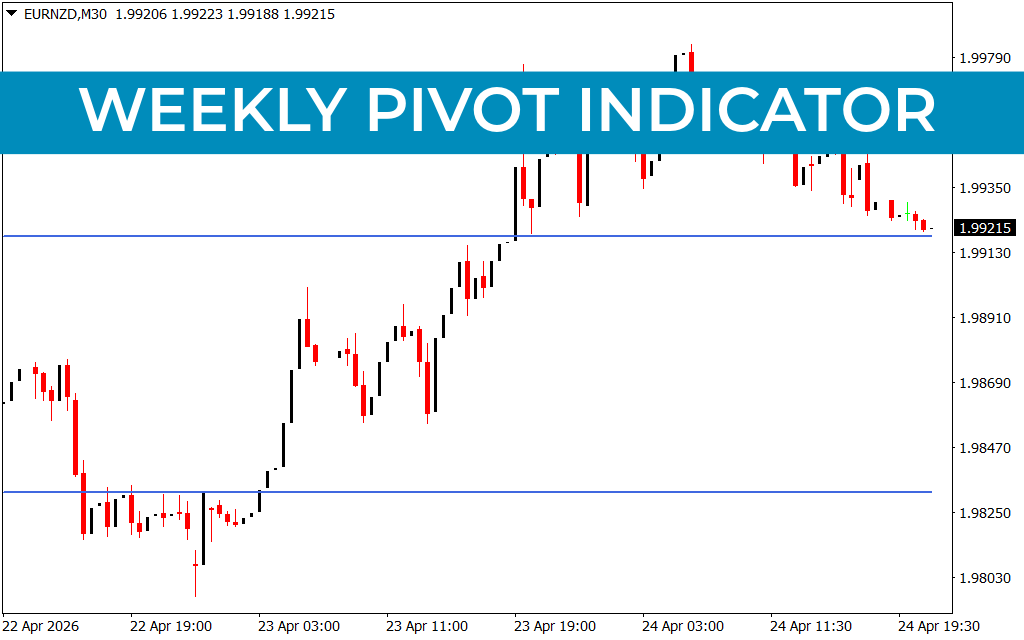
• Dynamic Support And Resistance
Horizontal grid lines help highlight natural market zones. Price frequently forms double bottoms, double tops, and trend reversals right on these lines. This makes them ideal for pattern-based trading and identifying high-probability setups.
How to Use the Horizontal Grid Lines Indicator
Identifying Trend Reversals
When price interacts with one of the horizontal grid levels and prints a reversal pattern—like a double bottom, hammer candle, or engulfing pattern—it may signal a potential trend shift.
Spotting Breakout Levels
The grid lines act like mini support and resistance levels. If the price consolidates at a grid line and breaks through it, this often signals a breakout continuation opportunity.
Using Psychological Zones
The green dotted psychological line can be used for:
Trade exits
Profit-taking
Trailing stops
Evaluating whether momentum is slowing down
These zones frequently attract institutional trader activity, making them highly relevant.
Enhancing Price Action Strategies
Traders who rely on candlestick patterns, structure breaks, or trend analysis can use these grid lines to increase precision and confidence in their setups.
Best Practices
Use on any timeframe, from M1 Scalping to monthly charts
Combine with trend indicators (MA, MACD) for additional validation
Watch for candlestick patterns at grid levels for reversal trades
Use tighter grid spacing for scalping and larger spacing for swing trading
Conclusion
The Horizontal Grid Lines Indicator for MT4 is a straightforward but highly effective tool for revealing support, resistance, and Trend Reversal zones. Whether you're trading breakouts, reversals, or psychological levels, this indicator can dramatically improve your chart analysis and trade accuracy. Best of all, it’s free to download and easy to install.
Visit IndicatorForest.com today to download the Horizontal Grid Lines Indicator and enhance your precision in the Forex market.
FAQ
3 Downloads
Published:
Nov 16, 2025 08:10 AM
Category: