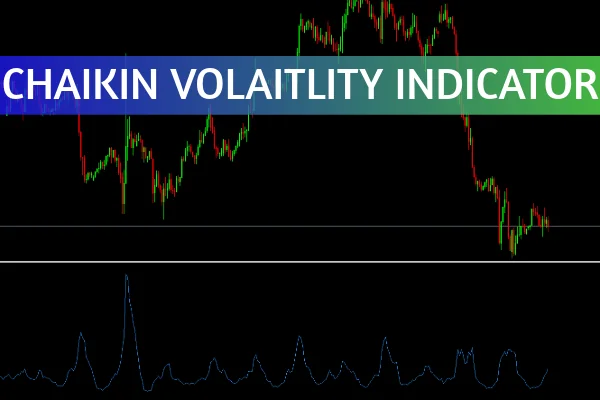
The Chaikins Volatility Indicator MT5 is a powerful technical analysis tool that helps traders measure the volatility of the market by analyzing the relationship between the MACD (Moving Average Convergence Divergence) and the accumulation-distribution line. This indicator was developed by Marc Chaikin to identify shifts in market momentum and potential trend reversals.
Unlike standard volatility indicators that rely on price ranges alone, the Chaikins Volatility indicator focuses on the difference between high and low prices over a specific period. This makes it particularly effective for forex traders, stock traders, and investors who want to anticipate changes in price direction before they become obvious.
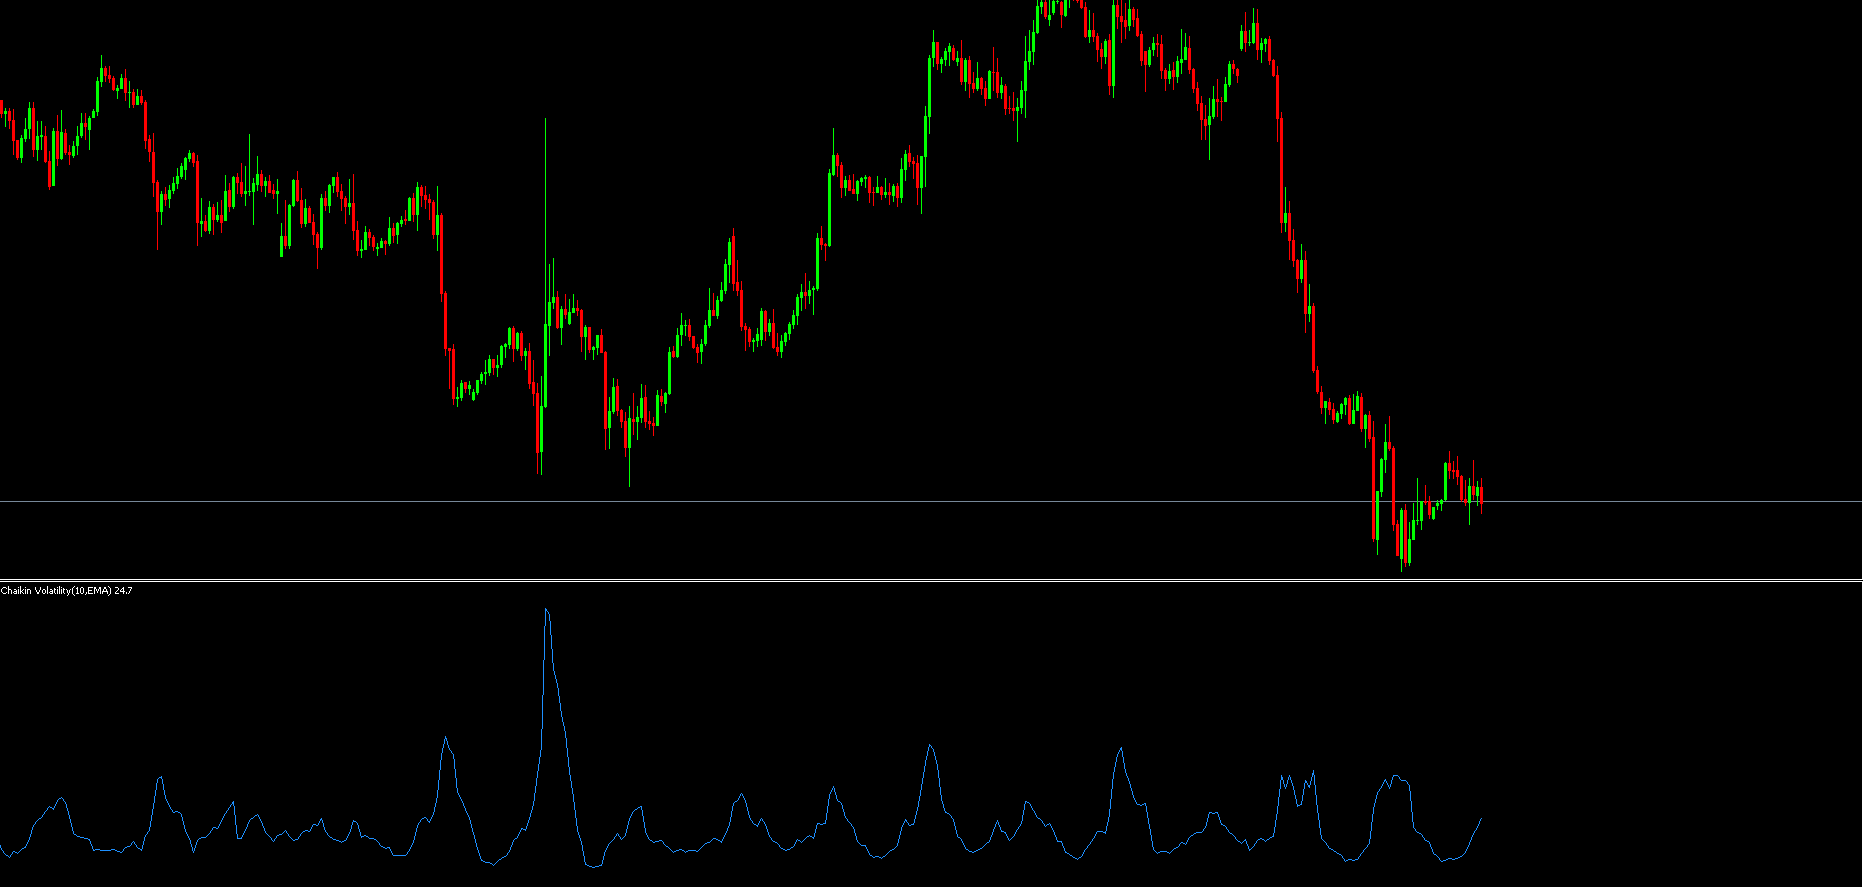
The Chaikins Volatility Indicator MT5 measures how quickly prices are changing. It compares the difference between the high and low prices for each period and then calculates the rate of change of this difference over time.
In simple terms, when volatility increases, it often signals that a trend reversal or breakout might occur soon. Conversely, low volatility can indicate a period of price consolidation.
The indicator is often used with the MACD Accumulation Distribution line rather than just closing prices. This approach is more accurate because it considers market participation (volume) and price momentum, helping traders make better-informed decisions.
A buy opportunity occurs when the accumulation-distribution line crosses above the center line of the indicator after a period of positive divergence. This scenario indicates that buyers are entering the market, and a bullish trend may soon follow.
A sell opportunity occurs when the center line crosses below the accumulation-distribution line, confirming a negative divergence. This situation suggests that selling pressure is increasing, and prices may start to decline.
These signals are most reliable when combined with other tools such as:
Moving Averages for confirming the trend direction
Relative Strength Index (RSI) for momentum strength
Bollinger Bands for additional volatility confirmation
In forex trading, this indicator helps identify high-volatility phases before large currency pair movements. Traders can use it to adjust stop-loss levels or prepare for potential breakout opportunities.
In equity trading, it works well for spotting early signals of trend reversals or continuations. When volatility spikes following a consolidation phase, traders can anticipate strong directional moves in the stock market.
Combine with Other Indicators: The Chaikins Volatility indicator works best alongside other technical tools like MACD, RSI, and Volume indicators.
Watch for Divergence: Divergence between price movement and the indicator line often signals a reversal point.
Avoid False Signals: During sideways markets, the indicator may show noise. Use higher time frames to confirm trends.
The Chaikins Volatility Indicator MT5 provides traders with valuable insight into market momentum and volatility shifts. It’s an essential tool for anyone looking to predict breakouts, trend reversals, or consolidation periods.
When combined with other technical indicators, such as the MACD or RSI, the Chaikins Volatility Indicator becomes even more powerful, helping traders make precise entry and exit decisions.
To download the Chaikins Volatility Indicator MT5 and explore more trading tools, visit IndicatorForest.com — your trusted source for professional forex indicators and strategies.
Published:
Oct 28, 2025 12:44 PM
Category: