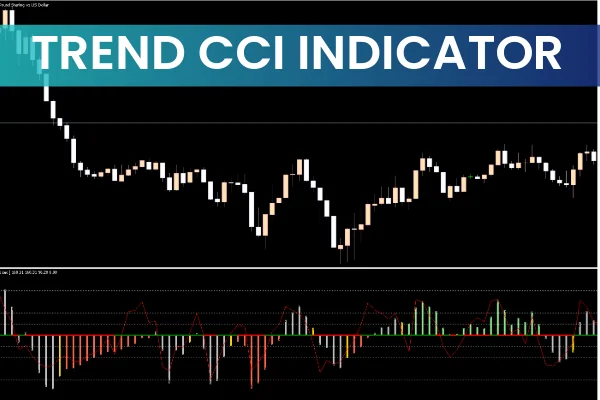
The Trend CCI (Commodity Channel Index) Indicator for MetaTrader 5 is a versatile momentum-based oscillator designed to help traders identify market trends, momentum shifts, and potential reversal zones. This advanced tool combines the classic CCI calculation with a Momentum Detector, producing an intuitive and information-rich indicator suitable for all experience levels.

By integrating two types of analysis—trend direction and momentum—the Trend CCI gives traders a comprehensive view of market behavior in one visual display. Whether you are Scalping on lower timeframes or trading swing positions on higher charts, this indicator adapts well to multiple strategies.
How the Trend CCI Indicator Works
The indicator analyzes price deviation from its statistical average, then measures how strongly the price is moving relative to recent data. It displays three key elements:
CCI Line – Measures trend direction and momentum
Overbought/Oversold Zones – Defined at +250 and –250
Histogram Bars – Represent the strength or weakness of price momentum
A reading above 0.00 suggests bullish bias, whereas a reading below 0.00 indicates bearish bias. The overbought and oversold levels highlight areas where price may reverse, while the histogram helps confirm acceleration or weakening of the market trend.
Best Timeframes and Trading Styles
The Trend CCI Indicator is flexible across all market environments:
Scalping – Use M30 and below to capture quick intraday moves
Day / Intraday Trading – Use H1–H4 for structured trading setups
Swing Trading – Use H4 and Daily to filter noise and follow major trends
Its simplicity and multi-layered feedback make it suitable for beginner, intermediate, and advanced traders.
How to Trade Using the Trend CCI Indicator
Not a Standalone Entry or Exit Tool
Although powerful, the Trend CCI should not be used alone. Market noise can generate false signals, especially during consolidation. Combining it with Price Action, support/resistance analysis, or trend indicators helps ensure higher-probability trades.
Identifying Buy Signals
A long (BUY) setup involves two key conditions:
CCI enters oversold territory (below –250)
CCI line crosses back above the 0.00 centerline, indicating bullish recovery
Once these conditions appear, traders should wait for price action confirmation, such as:
Bullish engulfing candle
Break of structure
Bullish order block
Strong rejection wick
When both indicator and price action align, the probability of a successful long position increases significantly.
Identifying Sell Signals
A short (SELL) setup follows the inverse logic:
CCI enters overbought territory (above +250)
CCI crosses below the 0.00 centerline, signaling bearish momentum
Again, always confirm the move with price action patterns, such as bearish engulfing candles or break below a key support level.
Using this two-stage confirmation method helps filter out false reversals and increases trade reliability.
Practical Example of Trend CCI Usage
On an MT5 chart, the Trend CCI might show the CCI line dipping into oversold territory. As price stabilizes and the CCI crosses above 0.00 while histogram bars turn positive, a possible bullish reversal may be forming.
Conversely, when the CCI spikes above +250 and later crosses below 0.00, the asset may be signaling the start of a fresh bearish trend.
This dual nature—momentum plus trend direction—makes the Trend CCI a high-value indicator for both trend traders and reversal traders.
Conclusion
The Trend CCI Indicator for MT5 is a dynamic and informative tool designed to help traders assess market conditions quickly and accurately. By highlighting trend direction, momentum strength, and reversal zones, it enhances trading efficiency and helps traders make informed decisions.
Whether you scalp, day trade, or swing trade, the Trend CCI offers everything you need to improve your strategy and spot higher-probability setups.
For more advanced indicators and professional trading tools, visit IndicatorForest.com and explore our complete collection.
FAQ
1 Download
Published:
Nov 22, 2025 08:40 AM
Category: