The Corrected RSX Indicator for MT5 is an advanced version of the traditional RSI designed to filter out market noise and provide more accurate trading signals. This indicator helps traders determine market dynamics, overbought and oversold zones, and ideal entry and exit points. Unlike standard RSI, the Corrected RSX can be smoothed without lag, making it suitable for day trading, Scalping, and swing trading.
How the Corrected RSX Indicator Works
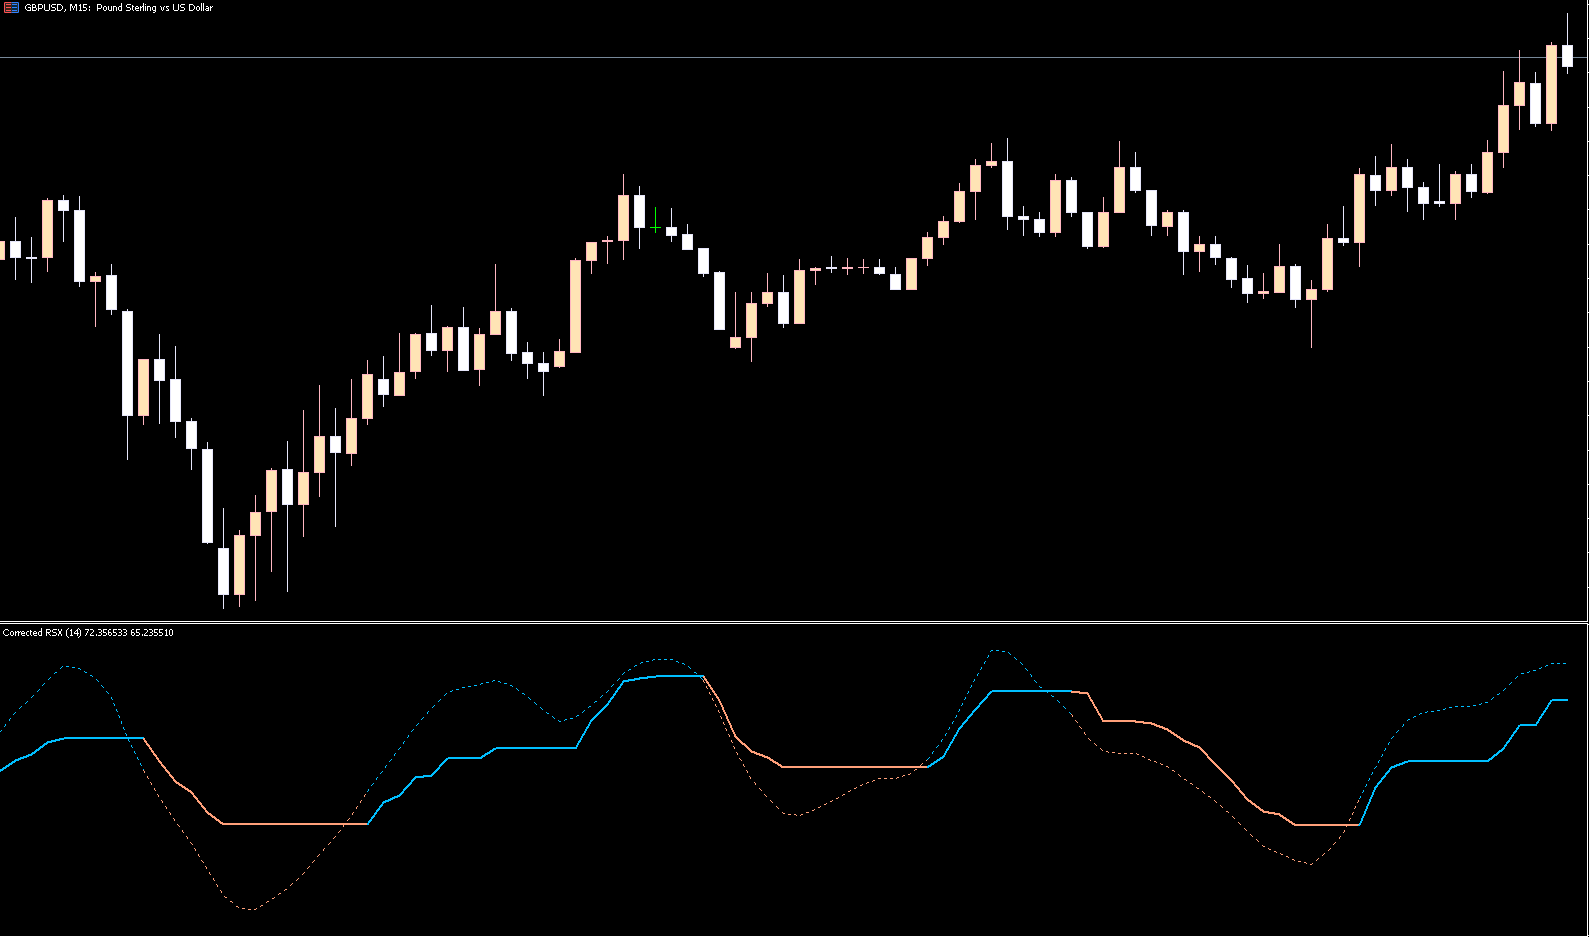
The indicator plots its window below the price chart and consists of:
RSX Line – smooths market data to reduce false signals.
Dotted Line – changes color to indicate buy (blue) or sell (orange) signals.
Moving Average Line – shows market movement and changes color from light green to pale purple.
Zero-Line Bar – changes color to red, green, or yellow; yellow indicates a market decision zone.
The indicator ranges from 0 to 100, with levels below 20 representing oversold conditions and levels above 80 indicating overbought conditions.
How to Use the Corrected RSX Indicator
Buy Signal
The dotted RSX line turns blue and crosses above the Corrected RSX line.
The price is in the oversold zone (below 20), signaling a potential Trend Reversal.
Enter a long position following confirmation.
Sell Signal
The dotted RSX line turns orange and moves downward.
The price is in the overbought zone (above 80), indicating a potential downward trend.
Enter a short position following confirmation.
Exit Strategy
Exit a long trade when the RSX line turns orange during an uptrend.
Exit a short trade when the RSX line turns blue during a downtrend.
Installation on MT5
The RSX indicator is not included by default in MT5. To install:
Download the Corrected RSX indicator file from our website.
Copy the file to the MQL5/Indicators folder in MT5.
Restart MT5, and the indicator will appear in your list of custom indicators.
Trading Example
On a GBP/USD chart, the Corrected RSX shows the following:
The RSX line turns blue, indicating a bullish trend. The moving average changes color to light green or pale purple, confirming the uptrend.
Enter a BUY trade at the confirmed signal.
Exit when the RSX line turns orange, indicating a downward move or trend reversal.
Similarly, a sell signal occurs when the dotted line turns orange, and the moving average mimics a downtrend.
Benefits of the Corrected RSX Indicator
Eliminates market noise for clearer signals.
Provides smooth, lag-free trading signals.
Helps identify overbought and oversold zones.
Ideal for trend-following strategies across scalping, day trading, and swing trading.
Color-coded lines simplify signal identification for quick decision-making.
Conclusion
The Corrected RSX Indicator for MT5 is a powerful tool for Forex traders seeking accurate entry and exit points. Its combination of a smooth RSX line, color-coded signals, and a moving average that follows Price Action allows traders to trade with the trend and maximize profit potential. Download the Corrected RSX Indicator from IndicatorForest.com and start using a noise-free, reliable indicator for your Forex trading strategy.
FAQ
2 Downloads
Published:
Nov 19, 2025 12:45 PM
Category: