The Swami Stochastic Indicator for MT5 is a powerful technical analysis tool designed to identify overbought and oversold market conditions. What makes it unique is its color-coded heat map, which helps traders instantly recognize bullish and bearish trends. This feature simplifies decision-making for both beginner and professional forex traders.

Unlike the traditional stochastic indicator, the Swami version enhances market visualization by displaying multiple stochastic periods simultaneously. This provides a smoother, more reliable reading of market momentum — making it a valuable addition to any trader’s toolkit.
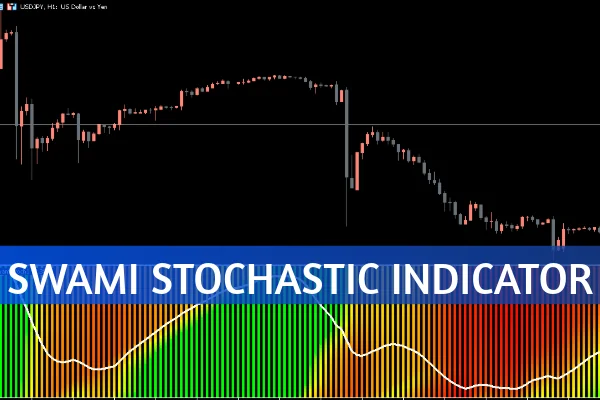
The indicator plots a stochastic oscillator line (usually white) with the standard 80 (overbought) and 20 (oversold) levels.
When the stochastic value drops below 20, it suggests that the market is oversold — a potential buying opportunity. Conversely, when values exceed 80, the market is considered overbought, signaling a possible sell opportunity.
The standout feature of the Swami Stochastic Indicator for MT5 is its heat map. The map uses color coding — lime green for bullish trends and red for bearish trends — allowing traders to quickly determine overall market sentiment at a glance.
This visual component helps traders differentiate between weak corrections and strong trend reversals, an edge that can significantly improve entry and exit timing.
The Swami Stochastic Indicator for MT5 works across all chart timeframes and is suitable for multiple forex pairs and even other assets like indices or commodities.
Wait for the indicator to drop below the 20 level (oversold zone).
When the value rises above 20 again, enter a buy trade.
Place your stop loss below the most recent swing low.
Exit when the indicator value moves above the 80 level or the heat map turns red.
Wait for the indicator to exceed the 80 level (overbought zone).
When it reverses and drops below 80, enter a sell trade.
Place a stop loss above the last swing high.
Exit the trade when the indicator moves below 20 or when the heat map turns lime green again.
Visual Clarity: The heat map helps distinguish bullish and bearish trends instantly.
Multi-Timeframe Use: Works effectively across short and long-term charts.
Beginner-Friendly: Clear signals make it easy to interpret market direction.
Accurate Entry Points: Uses multiple stochastic periods for refined analysis.
However, it’s important to note that reversal signals may not perform well during strong trending markets. In such cases, combining the indicator with a trend confirmation tool like a moving average can enhance accuracy.
At IndicatorForest.com, we provide professional-grade forex indicators for MetaTrader 4 and 5. The Swami Stochastic Indicator for MT5 is just one of our top tools designed to simplify technical analysis and boost trading performance.
Visit IndicatorForest.com today to download the indicator and explore our full range of premium forex tools.
The Swami Stochastic Indicator for MT5 combines the classic stochastic oscillator with an advanced heat map for a more intuitive trading experience. By clearly distinguishing between bullish and bearish zones, it helps traders identify the best entry and exit points with confidence. Whether you’re a novice or seasoned trader, this indicator offers a clear edge in market analysis.
Published:
Oct 18, 2025 03:19 AM
Category: