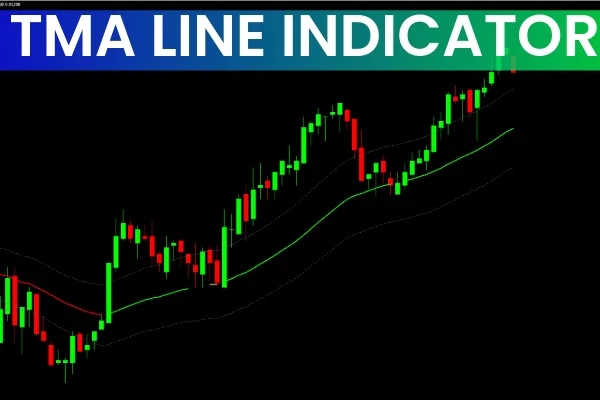
The TMA (Triangular Moving Average) Line indicator is a popular MT4 tool that plots a central smoothed moving-average line along with two outer bands. Visually, it appears similar to Bollinger Bands, but instead of standard deviation, it uses triangular moving averages derived from both price and volume data.
These upper and lower bands work as dynamic Support And Resistance, while the central line helps identify trend direction and market conditions.
How the TMA Line Works
The central TMA line changes color based on market direction:
Green → Uptrend (bullish control)
Red → Downtrend (bearish control)
Yellow → Neutral or ranging conditions
This color-coded structure makes it very intuitive for identifying market phases.
The main purpose of the TMA is to smooth price data, filtering out noise so traders can more easily spot trends and reversal zones.
How to Trade Using the TMA Line Indicator
The TMA line is primarily used for trend identification and timing entries/exits based on its color changes. The outer bands can help with take-profit and dynamic stop placement, but the core signals come from the central line.
TMA Buy Strategy
The central TMA line must be green
Indicates bullish momentum.
Wait for the green line to fully form
Avoid entering on the first color flicker.
Enter long at or near the central line
Ideally when price pulls back toward it.
Place stop-loss below the most recent swing low
Exit the trade when the central line turns yellow or red
Signals weakening or reversal.
TMA Sell Strategy
The central TMA line must be red
Bears are in control.
Wait for the red line to fully develop
Enter short at or near the central line
Place stop-loss above the most recent swing high
Exit the trade when the line turns yellow or green
Adjusting Period Settings
For short-term trading, use smaller periods (e.g., 10).
For long-term trend trading, use larger pe riods to reduce noise.
The TMA line works across all timeframes and is flexible enough to fit Scalping, swing trading, or position trading strategies.
Improving Reliability With Other Indicators
The TMA indicator works well when paired with oscillators that confirm momentum shifts, such as:
RSI (overbought/oversold confirmation)
MACD (momentum and trend confirmation)
Stochastic Oscillator (timing pullbacks)
Using a second indicator can filter out false color changes during choppy markets.
Conclusion
The TMA Line indicator is a clean, visual trend-following tool that helps traders identify trend direction, spot potential reversals, and time entries and exits through its central color-changing line. When combined with proper risk management and a confirmation indicator, it becomes a powerful addition to any trading strategy.
FAQ
1 Download
Published:
Nov 17, 2025 21:17 PM
Category: