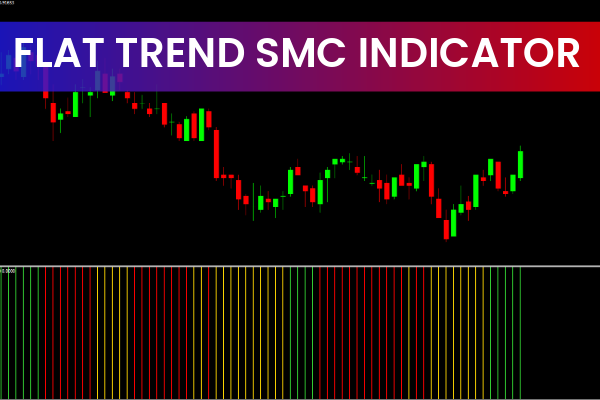
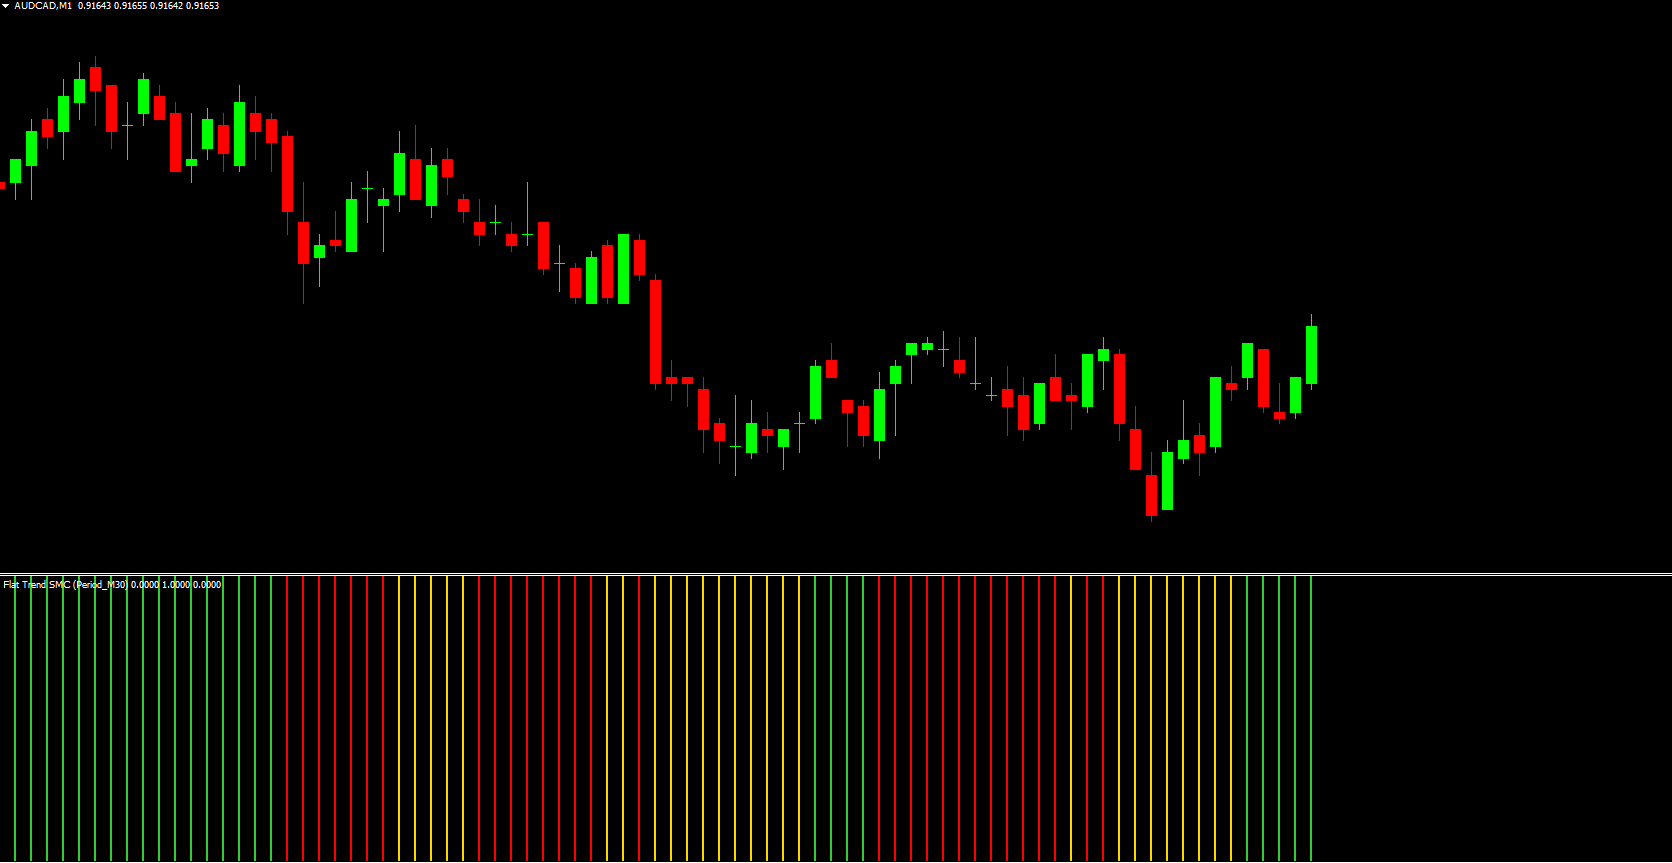
The Flat Trend SMC indicator is a powerful trend-following tool designed to give traders simple and highly visual buy and sell signals. Using a combination of fast, medium, and slow moving averages, the indicator plots colored bars—green, yellow, and red—beneath Price Action to show whether the market is bullish, bearish, or flat. Traders across Forex, crypto, indices, and stocks use the Flat Trend SMC indicator for Scalping and day trading due to its clarity, consistency, and ease of interpretation.
What Is the Flat Trend SMC Indicator?
The Flat Trend SMC indicator uses three moving averages to measure trend momentum. Instead of drawing the MAs on the chart, it converts them into color-coded bars in a separate window. This makes trend direction visually intuitive and eliminates chart clutter.
Green bars = bullish momentum and potential long trades
Yellow bars = flat/ranging market, no-trade zone
Red bars = bearish momentum and potential short trades
This structure helps traders avoid low-probability trades and focus only on clean market trends.
How the Trend Colors Work
Green Bars — Bullish Trend
Green bars indicate the fast MA is above the medium and slow averages. This alignment suggests buyers are in control. When the color switches to green after a yellow bar, it often signals the beginning of a new upward trend.
Yellow Bars — Flat or Range Market
Yellow bars mean the moving averages have compressed, and the trend has weakened. This is a sign to stay out of the market and wait for direction. Yellow bars also mark accumulation phases, often preceding strong breakouts.
Red Bars — Bearish Trend
Red bars show a confirmed downtrend. When red follows yellow, traders may look for short opportunities. This shift often marks the start of a new bearish leg.
How to Trade Using the Flat Trend SMC Indicator
Step-by-Step Trading Strategy
Wait for a yellow bar
This indicates the previous trend has weakened.
Take trades when yellow changes to a trend color:
Yellow → Green = Buy signal
Yellow → Red = Sell signal
Place Stop Loss
For buy trades: below the recent swing low
For sell trades: above the recent swing high
Exit the trade when bars change color or your take profit is reached.
Why the Yellow Bar Filter Works
The yellow bar signals consolidation—a pause after an uptrend or downtrend. Trading immediately after this pause gives traders a better chance of catching the next strong momentum surge.
Real Chart Example
Imagine analyzing the USD/CHF chart with the Flat Trend SMC indicator applied. During periods where yellow bars appear, price consolidates. When the bars flip to green, price begins a bullish trend. Conversely, when yellow bars flip to red, price starts declining. These transitions help traders catch high-probability moves while avoiding choppy zones.
Why Traders Prefer the Flat Trend SMC Indicator
Works on all markets (Forex, Crypto, Stocks, Indices)
Ideal for scalping and day trading
Simple color-coded decision-making
Filters out noise and false breakouts
Helps traders stay disciplined and avoid low-quality setups
If you want cleaner, more reliable Market Structure signals, the Flat Trend SMC indicator is one of the most user-friendly tools available.
Final Thoughts
The Flat Trend SMC indicator provides a clean and reliable way to identify trend direction and transitions. By understanding the color logic—yellow to green for buys, yellow to red for sells—you can trade with more precision and confidence. To access more premium indicators, expert guides, and trading tools, visit IndicatorForest.com today.
FAQ
Published:
Nov 15, 2025 00:18 AM
Category: