The RSI Candles Smoothed Indicator for MT5 is an enhanced version of the standard RSI Candles indicator, designed to provide a clearer view of market sentiment. Unlike the regular RSI Candles, this indicator incorporates a smoothing moving average (MA), reducing noise and making it easier to identify bullish and bearish trends on your chart.
Instead of showing the RSI value numerically, the indicator applies the RSI reading to each candlestick, visually coloring them based on market momentum. This approach allows traders to quickly interpret the trend and market sentiment without constantly referring to an RSI window.
How the RSI Candles Smoothed Indicator Works
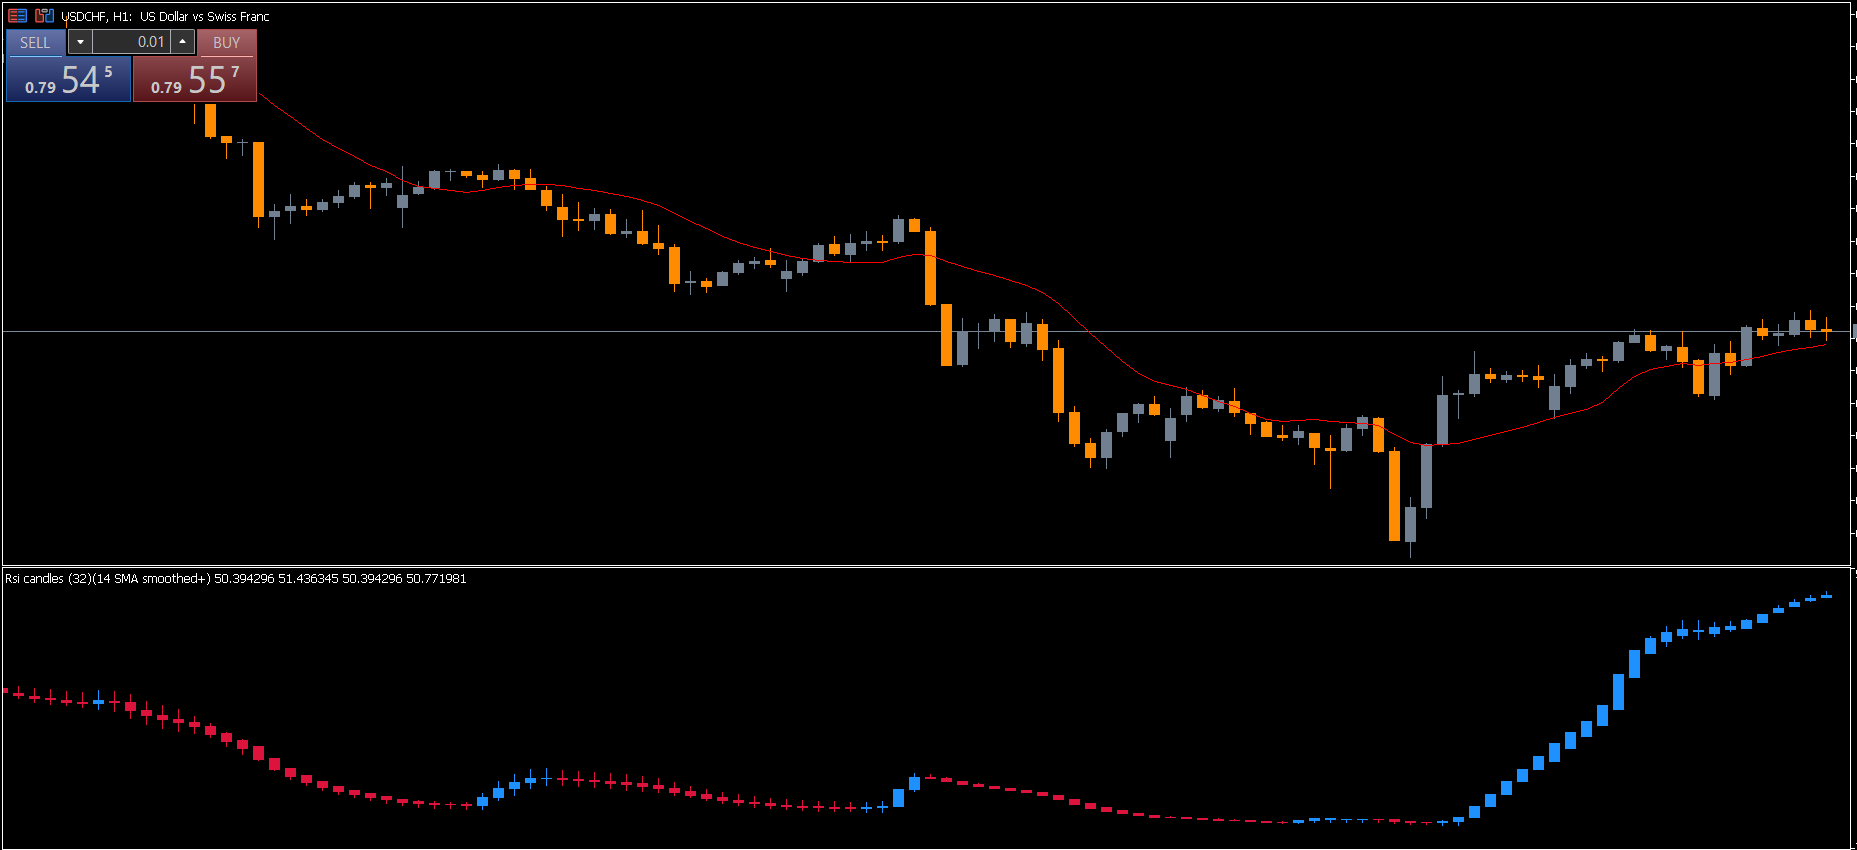
The indicator focuses on the 50 RSI level as the key threshold:
RSI above 50: Indicates bullish sentiment. The candle color changes to blue.
RSI below 50: Indicates bearish sentiment. The candle color changes to red.
The smoothing MA reduces erratic signals that can occur with a standard RSI, providing a cleaner and more reliable representation of price momentum.
How to Read the RSI Candles Smoothed Indicator
Observe Candle Colors:
Blue candles indicate bullish conditions, while red candles represent bearish conditions. Continuous streaks of one color suggest a strong trend.
Analyze Trend Direction:
For example, on the EUR/USD chart, multiple consecutive red candles below the 50 level indicate a sustained bearish trend. Conversely, blue candles above 50 signify a bullish trend.
Confirm with Other Tools:
While the indicator is powerful, it is best used alongside other technical analysis tools such as:
Price Action patterns
Support And Resistance levels
Moving averages or trendlines
This combined approach ensures higher accuracy and reduces the likelihood of false entries.
Trading Strategies with RSI Candles Smoothed
Trend-Following Trades
Enter long trades when blue candles appear above the 50 level and the trend aligns with higher timeframe analysis.
Enter short trades when red candles appear below 50 and the trend is confirmed.
Reversal Signals
Look for a change in candle color at key support or resistance zones.
Confirm reversal with additional price action indicators before entering a trade.
Multi-Timeframe Analysis
The indicator can be applied to different timeframes (H1, H4, D1) to capture both short-term momentum and long-term trend direction, making it versatile for scalpers and swing traders alike.
Advantages of Using RSI Candles Smoothed
Less Noisy: The smoothing MA minimizes erratic fluctuations in RSI signals.
Visual Clarity: Color-coded candlesticks make trend reading faster and easier.
Multi-Timeframe Use: Effective for intraday, daily, and weekly analysis.
Supports Decision-Making: Works well alongside other technical indicators for higher accuracy.
Conclusion
The RSI Candles Smoothed Indicator for MT5 is an efficient tool for observing bullish and bearish sentiment with a cleaner, less noisy display than standard RSI indicators. By providing color-coded candlesticks based on RSI levels, it allows traders to quickly gauge market momentum and make informed trading decisions.
For more trading tools and to download the RSI Candles Smoothed Indicator for free, visit IndicatorForest.com today.
FAQ
4 Downloads
Published:
Nov 17, 2025 10:31 AM
Category: