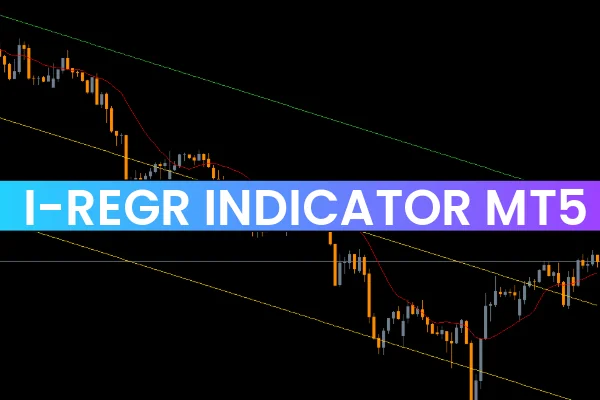
The i-Regr Indicator for MetaTrader 5 is a powerful parallel line indicator designed to help forex traders identify trend direction and potential reversal zones. Built on the principle of linear regression, the indicator calculates the maximum and minimum asset price levels and draws equidistant parallel lines, creating a dynamic price channel. This price channel acts as a visual guide for potential Support And Resistance levels, which traders can use as BUY or SELL zones to enter trades confidently.
The i-Regr Indicator is suitable for both short-term and long-term trend analysis. Its dynamic nature makes it ideal for various trading strategies, including Scalping, intraday, and swing trading. Additionally, it is accessible to all levels of traders—beginners, intermediates, and advanced users alike.
How the i-Regr Indicator Works
The indicator uses equidistant parallel lines to define a price channel:
Upper line (green): Acts as a potential resistance zone.
Lower line (yellow): Acts as a potential support zone.
Middle line (optional): Helps define mid-channel price behavior and Trend Strength.
These parallel lines provide a clear visualization of the Market Structure, making it easier to anticipate trend reversals and price reactions at key levels.
How to Trade Using the i-Regr Indicator
Trading with the i-Regr Indicator requires a combination of trend recognition, Price Action, and confirmation.
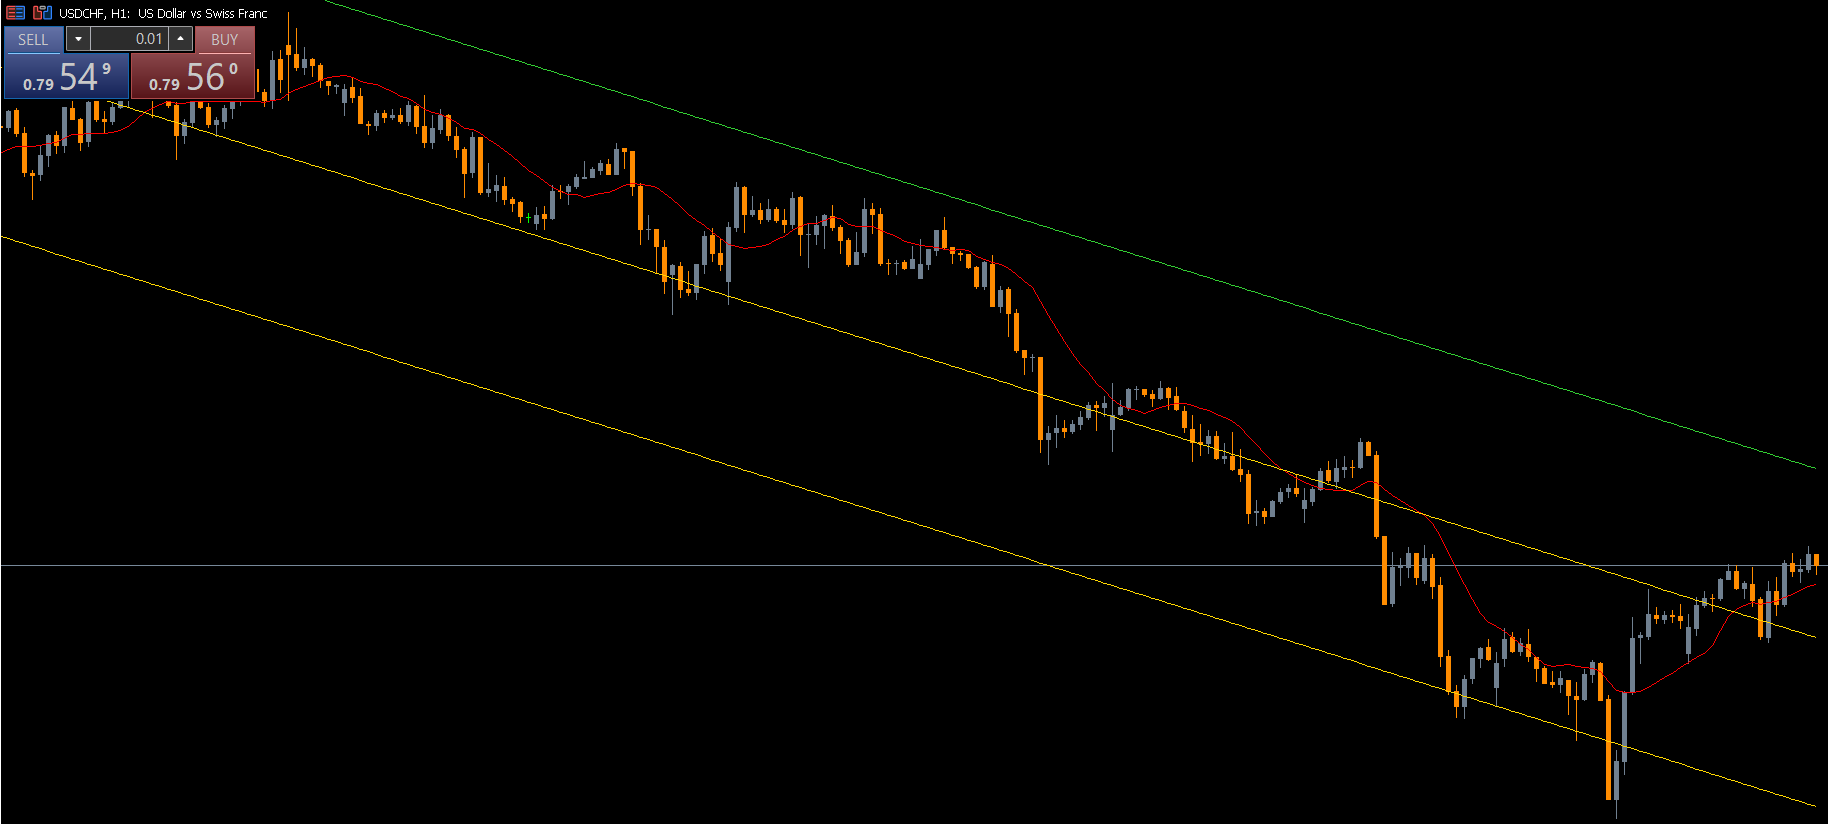
Identifying Buy (Long) Opportunities
Wait for the indicator to detect a trend and draw the parallel lines.
Observe if the price touches the lower yellow line with a visible wick deviation.
Confirm the trend by waiting for a bullish candlestick to form at the support zone.
Once confirmed, enter a BUY position. Place the stop-loss a few points below the yellow line, and set Take Profit near the upper green line.
Identifying Sell (Short) Opportunities
Look for the price touching the upper green line with a visible wick.
Confirm the setup with a bearish candlestick at the resistance zone.
Enter a SELL position, placing stop-loss slightly above the green line and Take Profit near the lower yellow line.
Managing Trades
Break even as soon as the price moves slightly past the middle or confirmation line.
Use the channel boundaries as a guide for risk management, trailing stops, and profit targets.
Advantages of Using the i-Regr Indicator
Chart-Friendly: Clean parallel lines help traders easily read market trends.
Accurate Reversal Signals: Provides high-probability setups using linear regression channels.
Versatile: Suitable for all timeframes, currency pairs, and trading styles.
User-Friendly: Ideal for beginners and advanced traders alike.
Free to Download: Accessible to all forex traders.
Trading Example
For instance, on a EUR/USD chart, a BUY signal occurs when the price touches the yellow support line, forms a bullish candlestick, and aligns with the trend. The upper green line serves as the Take Profit zone, while a stop-loss is placed just below the yellow line. Conversely, when the price hits the upper green line with a bearish candle, a SELL trade setup is confirmed, using the yellow line as the profit target.
Conclusion
The i-Regr Indicator for MT5 is a reliable tool for forex traders looking to identify trends and potential price reversal zones. Its parallel line price channels make market analysis simple and effective. The indicator is charting-friendly, easy to understand, and suitable for all trader levels. Best of all, it is free to download and can be integrated into any trading strategy.
Visit IndicatorForest.com to download the i-Regr Indicator and enhance your trading strategy today!
FAQ
5 Downloads
Published:
Nov 17, 2025 09:35 AM
Category: