The Floating Point Indicator is one of the most effective technical tools for trend trading on MetaTrader 4. By analyzing previous market history and current price behavior, it helps traders determine the start and end of trends, making it easier to identify profitable trade opportunities.
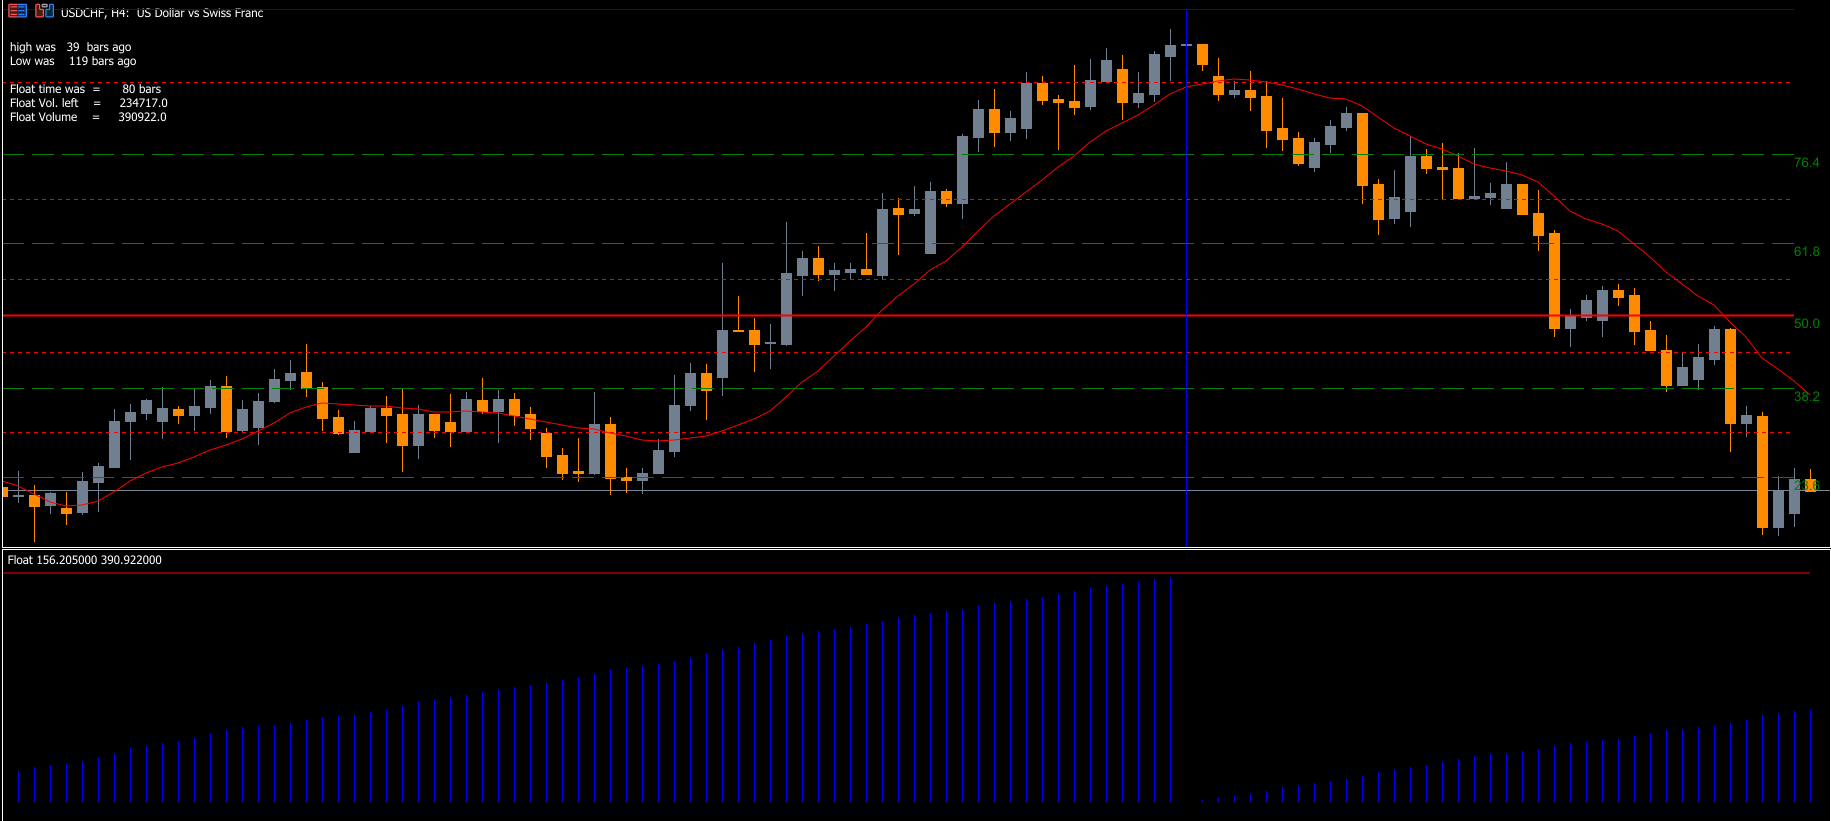
The indicator displays trends in a separate window below the price chart, showing the duration since recent highs and lows were formed. Additionally, it integrates DiNapoli and Fibonacci levels to enhance market analysis and support trend-based trading strategies.
How the Floating Point Indicator Works
The Floating Point Indicator monitors Price Action and detects trend initiation and termination points. Key features include:
Trend Start and End – Visually marks when a trend begins and ends
Highs and Lows Tracking – Shows how many bars ago a high or low occurred
Fibonacci & DiNapoli Levels – Provides additional support/resistance and entry zones
Trend Duration Measurement – Helps traders time entries based on trend length
By combining historical price analysis with current market trends, this indicator allows traders to anticipate trend reversals and position themselves for higher-probability trades.
How to Use the Floating Point Indicator
The main goal is to identify trends and time your entries for maximum profitability:
Trend Identification
Observe the indicator window for current trend formation
Identify when a trend is ending, indicated by the start and end points
Use the information to plan your entry in the next trend direction
Riding the Trend
Enter the market at the beginning of a new trend for higher probability
Use DiNapoli and Fibonacci levels to determine Support And Resistance zones for safer entries
Monitor the indicator to track how long the trend has been active
Risk Management
Set stop losses near the previous high or low
Take profits based on trend duration and nearby Fibonacci levels
Avoid entering trades during periods of trend uncertainty or flat market conditions
Trading Example
On a USD/JPY chart, the Floating Point Indicator provides clear guidance:
The indicator shows the recent low occurred 4 bars ago, and the recent high occurred 92 bars ago
A new trend starts forming below the price action window
Traders can plan a short position in line with the emerging downtrend
This approach allows traders to follow the trend instead of attempting to predict reversals prematurely, improving trading accuracy and reducing risk.
Benefits of the Floating Point Indicator
Simplifies trend analysis by clearly marking start and end points
Supports multiple timeframes, from short-term intraday charts to long-term swing charts
Compatible with any currency pair or trading instrument
Enhances decision-making with Fibonacci and DiNapoli levels
Helps traders time trend entries for higher probability setups
By providing a clear and structured visualization of trends, the Floating Point Indicator reduces guesswork and helps traders focus on high-quality trade opportunities.
Conclusion
The Floating Point Indicator for MT4 is an essential tool for trend traders seeking clarity on market movements. By displaying trend start and end points, tracking highs and lows, and integrating Fibonacci/DiNapoli levels, it enables traders to enter trades at optimal times and ride trends effectively.
For more free MT4 indicators and trading tools, visit IndicatorForest.com.
FAQ
7 Downloads
Published:
Nov 13, 2025 21:57 PM
Category: