Master Trend Momentum with the Relative Strength Levy Indicator for MT4
In the pursuit of market outperformance, professional traders often move beyond simple moving averages to look for "relative" momentum. While standard indicators tell you where the price is, they rarely tell you how strong a trend is compared to its historical baseline. The Relative Strength Levy (RSL) Indicator for MetaTrader 4 (MT4) is a specialized technical tool designed to solve this problem. Developed by Robert Levy, this indicator measures the strength of a current price relative to its moving average, providing a mathematical score that identifies high-conviction trends and potential exhaustion points.
The Science of Comparative Momentum
The Relative Strength Levy is not to be confused with the standard Relative Strength Index (RSI). While the RSI measures internal momentum (gains vs. losses), the RSL measures the ratio between the current closing price and a specific moving average (typically a 26-week or 130-day average in its original form). An RSL value above 1.0 indicates that the asset is trading above its average, signaling bullish strength, while a value below 1.0 suggests bearish weakness.
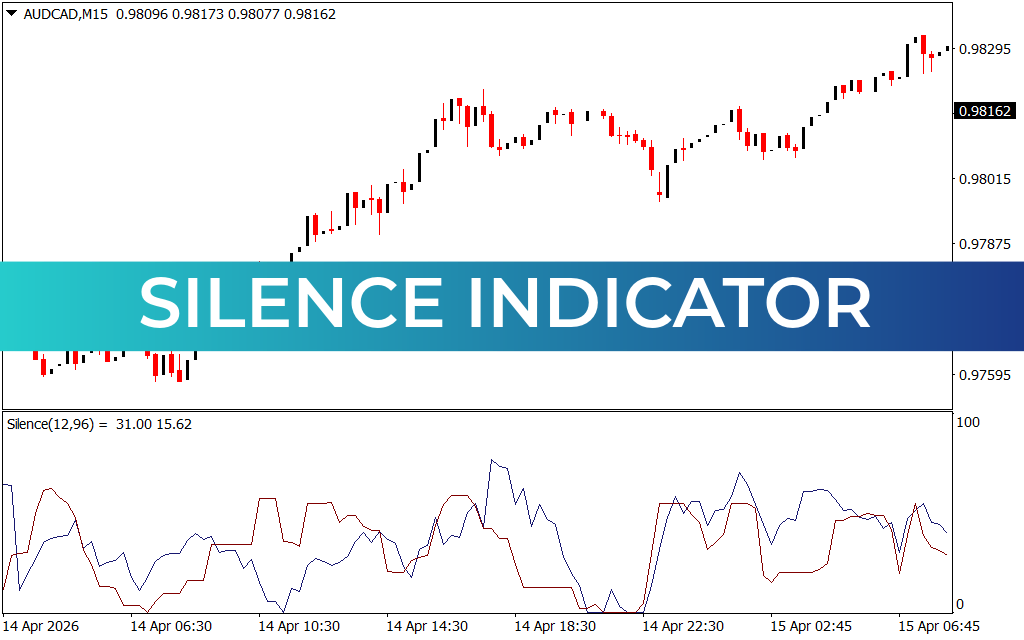
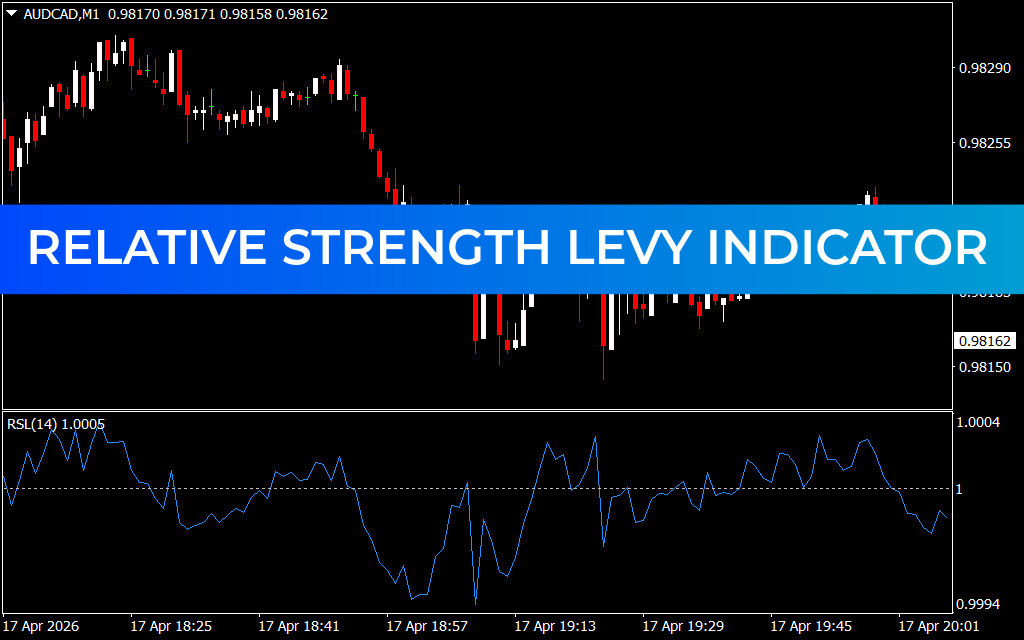
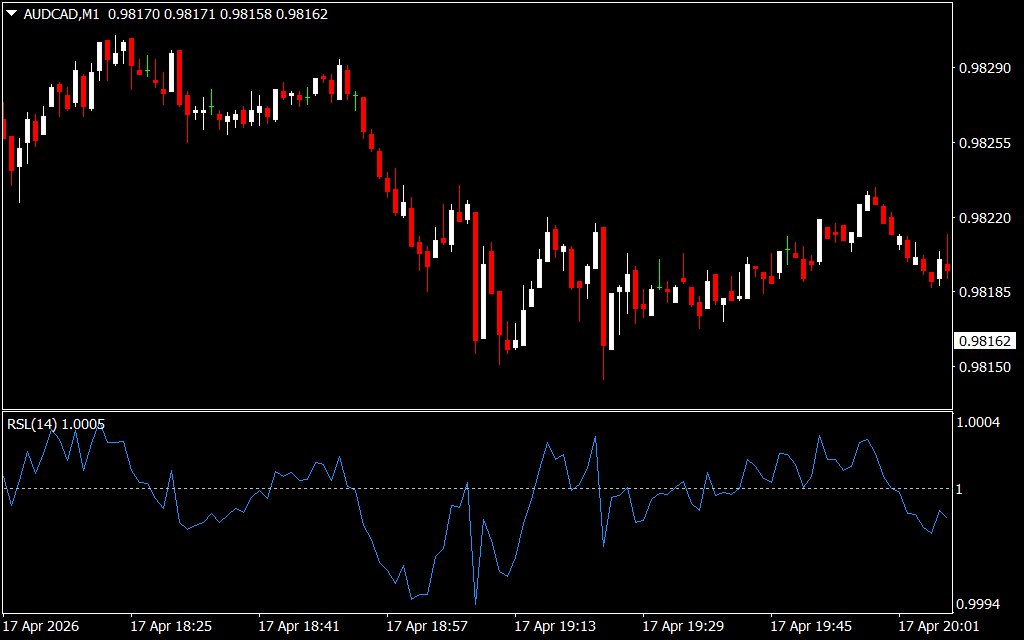
As demonstrated in technical analysis on diverse pair structures like AUD/CAD on the M1 timeframe, the RSL system provides several definitive operational advantages:
- Identifying Alpha Trends: The RSL is an exceptional tool for trend-following. By quantifying how far price has deviated from its mean, it helps traders identify "alpha" trends—moves backed by significant institutional momentum. As seen on recent M1 charts, a rising RSL line confirms that the trend is accelerating.
- Filtering Market Laggards: In a basket of currencies, the RSL allows you to rank pairs by their relative power. Professional traders use this to focus exclusively on the strongest performers, ensuring capital is always allocated to the most efficient market moves.
- Mechanical Overbought/Oversold Logic: While the RSL is primarily a trend-following tool, extreme deviations from the 1.0 baseline can signal exhaustion. When the RSL reaches historically high levels, it warns of a potential mean-reversion move, allowing traders to tighten stop-losses.
- Smoothed Signal Delivery: The MT4 version of the Relative Strength Levy often includes additional smoothing to filter out intraday noise. This results in a clean, responsive line that remains stable even during high-velocity price shifts.
Strategic Implementation for Systematic Traders
The Relative Strength Levy Indicator is an essential asset for any trader who values structural clarity and quantitative timing.
- Trend Confirmation Entry: Look for the RSL to cross above the 1.0 threshold. This signifies that the market has shifted from a consolidation phase into a confirmed bullish expansion, providing a high-probability entry signal.
- Pullback Trading: In a strong uptrend, an RSL that dips toward the 1.0 line without breaking below it represents a "value" opportunity. This identifies a pullback to the moving average that is likely to find institutional support.
- Cross-Asset Analysis: Use the RSL to compare different timeframes. A bullish RSL on the H1 chart combined with a fresh 1.0 crossover on the M5 chart creates a professional-grade confluence for a high-conviction intraday trade.
Conclusion
The Relative Strength Levy Indicator for MT4 is a definitive solution for traders who demand more than just lagging price data. By bridging the gap between historical averages and real-time momentum, it empowers you to navigate the financial markets with grounded, institutional confidence. Elevate your technical analysis today and master the strength of the trend with the RSL system.
1 Download
Last Update:
Apr 18, 2026 16:33 PM
Published:
Feb 05, 2026 21:54 PM
Category: