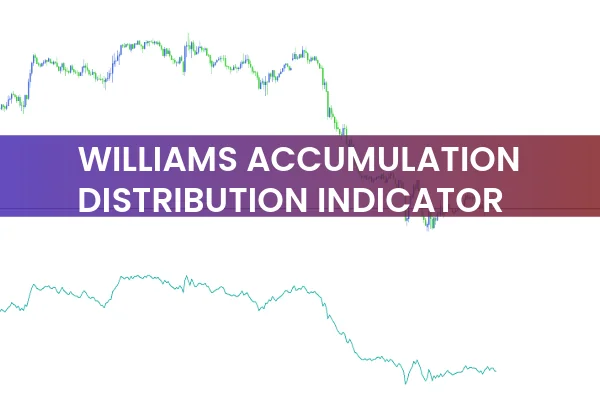
The Williams Accumulation Distribution Indicator for MT5 is a powerful technical tool designed to help traders identify divergences between price movement and underlying market momentum. Divergence trading is one of the most effective Forex strategies for spotting potential reversals before they occur.
This indicator calculates the cumulative sum of positive (accumulative) and negative (distributive) price movements, offering insights into whether buying or selling pressure is dominating the market. Unlike indicators that rely on trading volume, the Williams A/D uses only price data, making it an ideal tool for markets where accurate volume data is unavailable.
If you’re looking for an easy yet precise way to analyze trend strength and divergence, the Williams Accumulation Distribution Indicator for MT5 is a must-have addition to your trading toolkit.
Understanding the Williams Accumulation Distribution Indicator
The Williams A/D Indicator is based on the logic that price movements reflect accumulation (buying interest) or distribution (selling pressure).
Accumulation: When the indicator value rises, it shows that buyers are in control, pushing prices higher.
Distribution: When the indicator falls, it indicates that sellers dominate, causing prices to decline.
Unlike the Chaikin Accumulation/Distribution Line, which includes volume in its calculation, the Williams version omits it — focusing purely on price behavior. This makes it particularly useful for spotting divergences between Price Action and momentum in the absence of volume data.
How to Trade with the Williams Accumulation Distribution Indicator
Identify Trend Direction
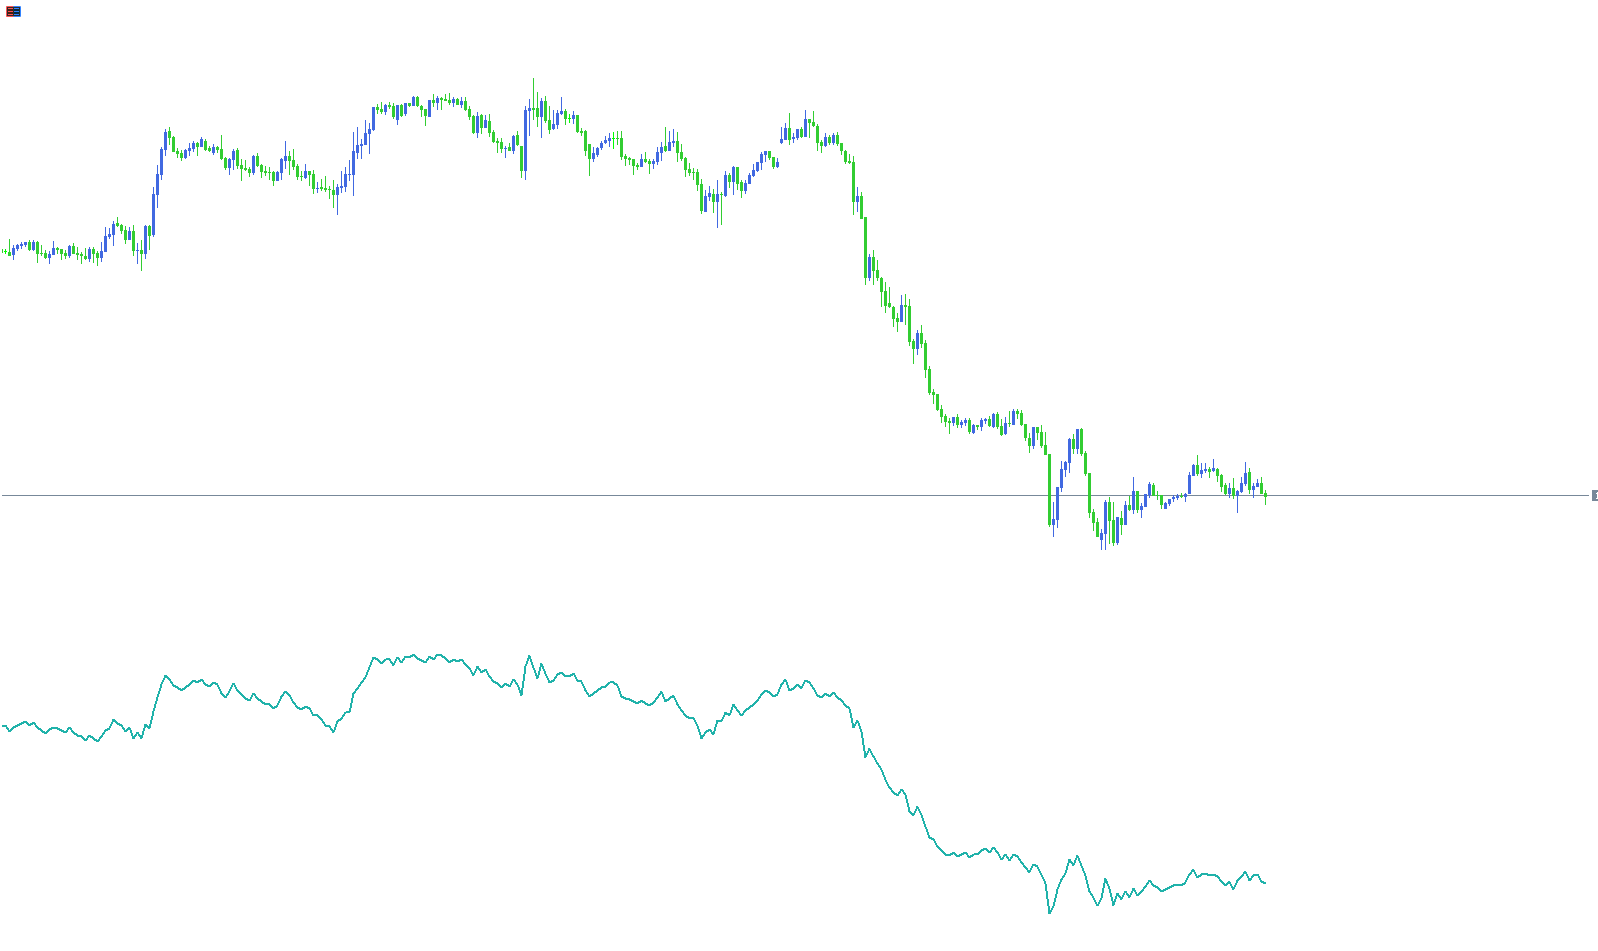
The first step is to analyze the general direction of the indicator:
When both price and indicator are moving upward, it confirms a bullish trend.
When both move downward, it confirms a bearish trend.
This alignment between price and the indicator reflects market harmony — the trend is likely to continue.
Detect Divergences (Key Reversal Signals)
The most valuable trading signal from the Williams A/D Indicator is divergence — when the indicator and price move in opposite directions.
Bullish Divergence:
When price forms a lower low, but the indicator makes a higher low, it signals weakening selling pressure. This often precedes a Trend Reversal upward.
Bearish Divergence:
When price makes a higher high, but the indicator forms a lower high, it shows that buying strength is fading. This typically signals a downward reversal ahead.
For the best results, use divergence confirmation with Candlestick Patterns (like bullish engulfing or hammer formations) or support/resistance levels.
Timeframe and Reliability
While the indicator performs well on multiple timeframes, it’s best used on H1 and higher charts. On smaller timeframes (like M1 or M5), the indicator may generate false signals due to short-term price noise.
Additionally, note that the Williams A/D Indicator does not account for price gaps, which can distort its readings. Avoid making decisions based solely on the indicator during such periods.
Example: Divergence on EUR/USD
On the EUR/USD hourly chart, suppose the price prints a new high, but the Williams Accumulation Distribution line fails to confirm with a higher high. This mismatch signals a bearish divergence, suggesting that momentum is weakening. Traders can look for short entry signals once a bearish candlestick pattern appears near the top.
Conversely, if price forms a new low but the indicator does not, it signals bullish divergence — a possible opportunity to enter a buy trade after confirming upward momentum.
Benefits of the Williams Accumulation Distribution Indicator
Detects Hidden and Regular Divergences: Helps identify early signs of trend exhaustion.
Volume-Free Analysis: Works even when volume data is unreliable or unavailable.
Simple Visualization: Displays accumulation and distribution phases clearly.
Versatile Application: Works across Forex, commodities, and index markets.
Ideal for Confirmation: Can be combined with trend-following or oscillator indicators for stronger signals.
Pro Tips for Using the Indicator
Combine with RSI or MACD: Using RSI or MACD alongside Williams A/D can improve divergence confirmation.
Avoid Low Timeframes: Stick to hourly or higher for more reliable trend analysis.
Use Price Action: Always verify divergence setups with candlestick or structural confirmation before entry.
Conclusion
The Williams Accumulation Distribution Indicator for MT5 offers traders a unique way to track accumulation, distribution, and divergence without relying on volume data. By spotting where price and indicator readings diverge, traders can anticipate trend reversals and make well-timed entries.
Whether you’re a novice learning divergence trading or an experienced Forex trader refining your strategy, this indicator can significantly improve your accuracy.
👉 Download the Williams Accumulation Distribution Indicator for MT5 for free at IndicatorForest.com and start detecting high-probability reversal signals today.
FAQ
The Williams Accumulation Distribution Indicator measures buying and selling pressure by analyzing the relationship between price and volume. It helps identify whether money is flowing into or out of the market, providing insights into trend strength and potential reversals.
When the indicator line is rising, it indicates accumulation (buying pressure) and potential bullish momentum. When the line is falling, it suggests distribution (selling pressure) and potential bearish momentum. Divergences between price and the indicator can signal potential reversals.
The indicator helps confirm trend strength by showing whether volume supports price movement. Rising price with rising A/D confirms bullish momentum, while falling price with falling A/D confirms bearish momentum. This volume confirmation adds an important layer to price analysis.
Use the indicator to confirm trend direction and identify potential reversals through divergence. Enter trades when A/D confirms price movement, and watch for divergences that may signal trend exhaustion. Combine with price action patterns or support/resistance levels for better accuracy.
Yes, Williams Accumulation Distribution works on all MT4 timeframes and currency pairs. It is suitable for scalping, day trading, and swing trading, though many traders find it most effective on H1 and H4 charts where volume patterns are clearer.
Published:
Nov 05, 2025 13:00 PM
Category: