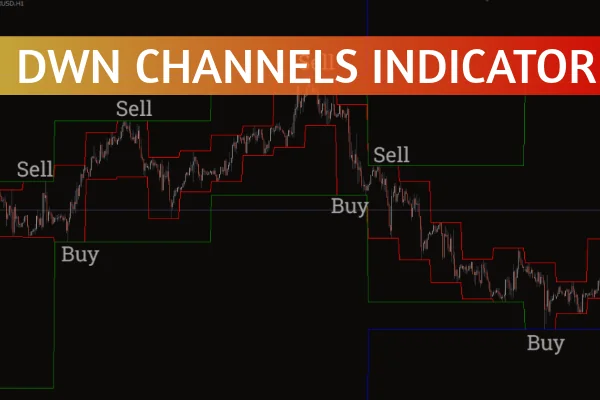
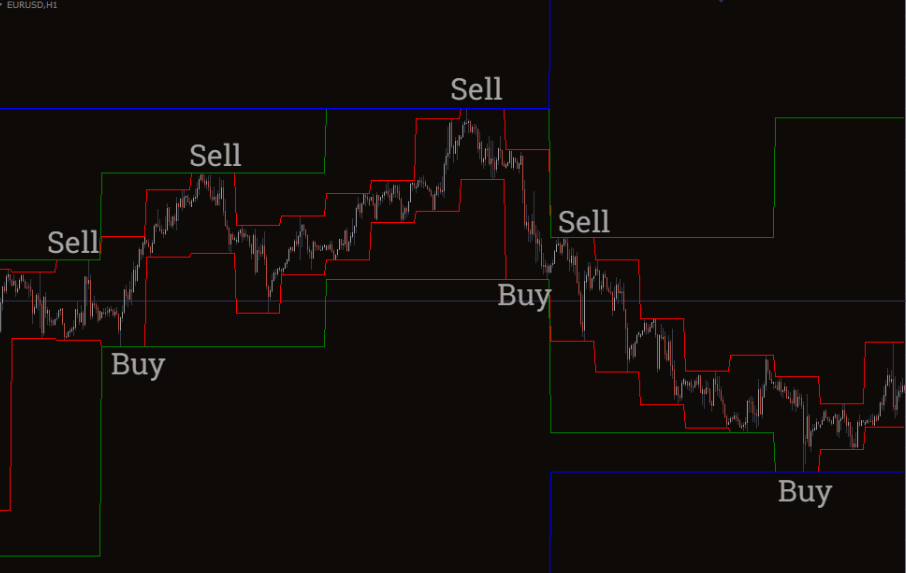
The DWM Channels Indicator for MT4 helps forex traders visualize dynamic support and resistance zones based on Daily, Weekly, and Monthly (DWM) highs and lows. By plotting these critical levels directly on a single chart, traders gain an immediate understanding of where price may reverse or break out, allowing for smarter entry and exit decisions.
Available at IndicatorForest.com, this indicator is ideal for both beginners and experienced traders who rely on technical analysis to navigate forex markets confidently.
The DWM Channels Indicator automatically plots three sets of color-coded channels:
Daily Channel (Red): Marks short-term intraday support and resistance.
Weekly Channel (Green): Highlights medium-term trading zones.
Monthly Channel (Blue): Defines long-term market structure and key turning points.
These channels are dynamic, meaning they adjust as new highs or lows are made within their respective timeframes. This ensures that the indicator always reflects up-to-date market conditions.
Because all three channels appear on the same chart, traders can instantly compare short-, medium-, and long-term levels without switching timeframes — a major advantage for multi-timeframe analysis.
Using Support and Resistance Zones
The highs and lows of each timeframe serve as powerful support and resistance zones. When the price approaches these levels, traders can watch for price rejection, consolidation, or breakout patterns to anticipate the next market move.
A common trading strategy involves waiting for price action confirmation — such as a candlestick reversal pattern or momentum breakout — before entering trades.
Dynamic Channel Adjustments
Since the DWM Channels Indicator updates automatically, these zones evolve as markets move. This dynamic adjustment is crucial for traders who follow trend continuation or trend reversal strategies.
For example:
If the daily channel shifts higher while the weekly and monthly remain flat, it may indicate a short-term bullish move within a larger consolidation.
Conversely, if all three channels align downward, traders can confirm a strong bearish trend.
There are several benefits to using the DWM Channels Indicator in your forex trading strategy:
Multi-Timeframe Analysis: View Daily, Weekly, and Monthly levels together.
Dynamic Updates: Always trade based on the latest market data.
Clear Visualization: Color-coded channels for easy interpretation.
Versatile Usage: Works for both scalping and swing trading strategies.
Enhances Accuracy: Reduces guesswork by focusing on reliable technical zones.
These features make the indicator suitable for both new traders learning to recognize support and resistance, and advanced traders optimizing entries and exits.
Always combine DWM Channels with price action confirmation or candlestick patterns before executing trades.
Avoid trading directly into major higher timeframe channels without confirmation.
Integrate this indicator with others like the RSI or MACD to filter signals.
Remember that higher timeframe levels (weekly and monthly) carry more significance than daily ones.
For an in-depth guide on improving your trading accuracy, check out our Forex Indicators Guide on IndicatorForest.com.
The DWM Channels Indicator for MT4 is a simple yet powerful tool that enhances your understanding of support and resistance. By plotting Daily, Weekly, and Monthly highs and lows in one place, traders can make informed decisions across different time horizons.
Whether you’re trading short-term breakouts or long-term reversals, this indicator provides valuable insights into market structure.
👉 Download or learn more about the DWM Channels Indicator at IndicatorForest.com and start trading with clarity today!
Published:
Oct 22, 2025 13:24 PM
Category: