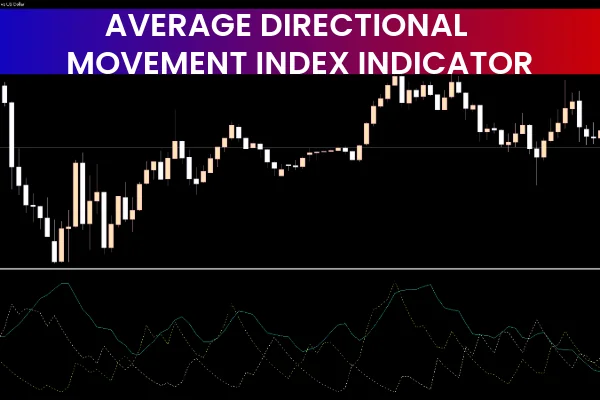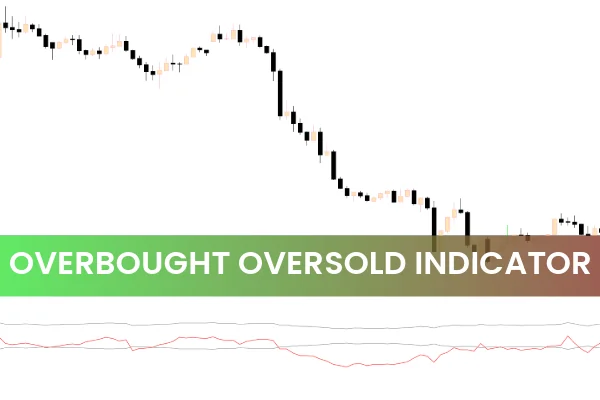
The Overbought Oversold (OO) Indicator for MT5 is a simple yet effective oscillator that resembles the Relative Strength Index (RSI). It consists of a single moving average (signal) line that oscillates between 0 and 100, helping traders identify potential reversal zones in the market.
Like RSI, this indicator highlights when a currency pair or asset is overbought or oversold, allowing traders to time their entries and exits more accurately. It also includes visual overbought and oversold bars, which enhance readability and make it easy to interpret market momentum.
How the Overbought Oversold (OO) Indicator Works
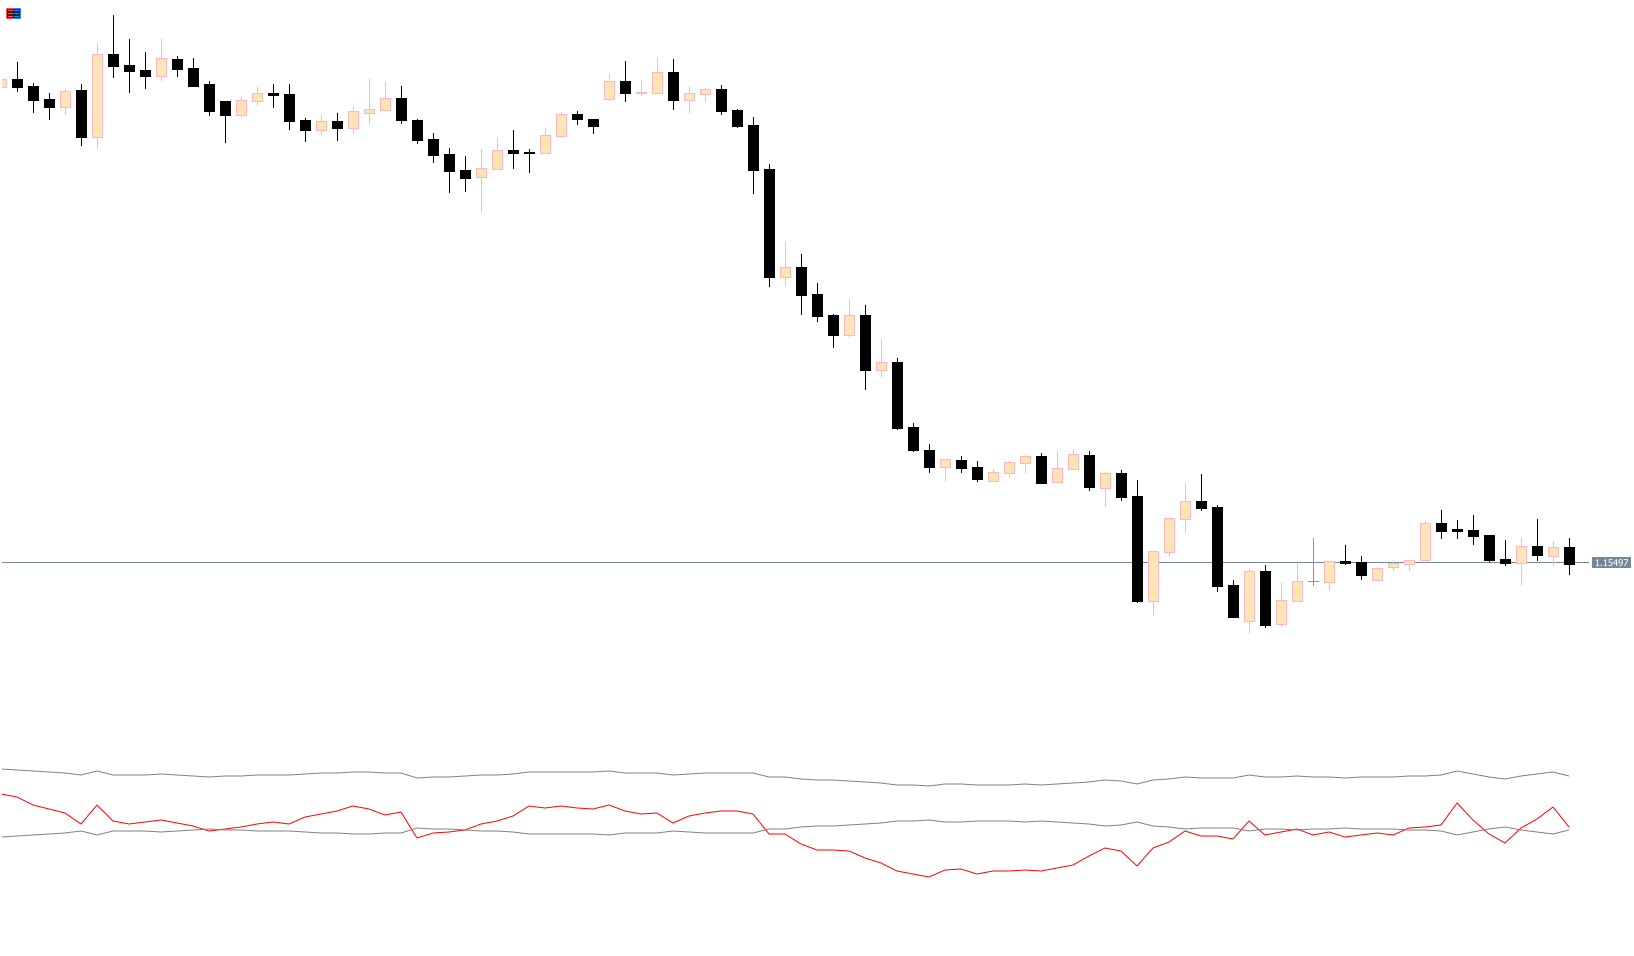
The indicator fluctuates within a fixed range of 0 to 100:
Above 70 → The market is overbought, signaling a possible price decline or short opportunity.
Below 30 → The market is oversold, signaling a possible price increase or long opportunity.
Whenever the MA line crosses these threshold levels, the indicator alerts traders to potential reversals. The OO bars display the current condition clearly—helping you recognize if the price is at an extreme level.
How to Trade Using the Overbought Oversold Indicator (OO) in MT5
The GBP/USD H1 chart example shows how the OO indicator generates BUY and SELL opportunities:
Overbought Zone (Above 70)
When the signal line rises above 70, it means the market is overbought.
Traders can prepare for a SELL setup or take profit on long positions.
Oversold Zone (Below 30)
When the signal line falls below 30, the market is oversold.
Traders can prepare for a BUY setup or close short positions.
Neutral Zone (Between 30 and 70)
The market is stable or consolidating.
Avoid trading during this range unless other indicators confirm a direction.
💡 Pro Tip: The OO indicator tends to perform best on higher timeframes (e.g., H4, Daily, or Weekly) where false signals are minimized.
Advantages of the Overbought Oversold Indicator for MT5
Simple and beginner-friendly design
Identifies market extremes with ease
Works on all MT5 timeframes and assets
Ideal for swing and position trading
Can be combined with RSI, MACD, or CCI for confirmation
Helps traders find precise entry and exit points
Which Indicator Is Best for Overbought and Oversold Levels?
There’s no single “best” indicator—it depends on your trading style. Commonly used tools include:
RSI (Relative Strength Index)
Stochastic Oscillator
Commodity Channel Index (CCI)
Overbought Oversold (OO)
Each indicator uses different mathematical calculations but serves the same purpose: identifying when the market may be due for a reversal.
What Is an Overbought or Oversold Position?
Oversold Position: When the indicator drops below 30, it signals the market may soon end its downtrend and start reversing upward.
Overbought Position: When the indicator climbs above 70, it signals the market may soon end its uptrend and turn downward.
These conditions help traders anticipate potential turning points in Price Action.
Conclusion
The Overbought Oversold (OO) Indicator for MT5 is a practical and user-friendly tool that highlights market extremes, helping traders make accurate BUY and SELL decisions. While it works effectively as a standalone indicator, combining it with RSI, MACD, or moving averages can enhance signal reliability.
Download the OO Indicator for free from IndicatorForest.com and start spotting profitable reversals today.
FAQ
3 Downloads
Published:
Nov 13, 2025 12:54 PM
Category: