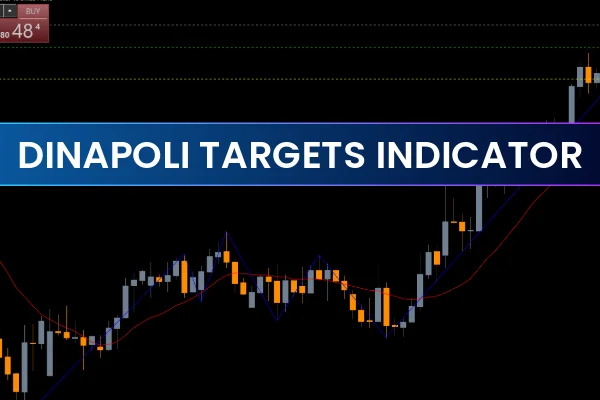
The Dinapoli Targets Indicator for MT5 is a professional technical analysis tool that automatically draws Dinapoli levels on your MetaTrader chart. These levels act as support and resistance zones, helping traders identify high-probability Trend Reversal and continuation areas.
Developed based on Fibonacci retracement and extension concepts, the Dinapoli Targets indicator helps determine optimal buy/sell zones, take-profit targets, and stop-loss placements. It’s suitable for all traders — from beginners learning chart structure to advanced traders fine-tuning entries and exits.
Download the Dinapoli Targets Indicator for MT5 free at IndicatorForest.com and take your technical trading strategy to the next level.
What Are Dinapoli Target Levels?
Dinapoli targets are Fibonacci-based levels that align with swing highs and lows to highlight key support and resistance areas. These zones are reliable trend reversal or continuation points, offering visual cues for strategic trading decisions.
The indicator draws horizontal dotted lines of various colors, representing:
White Line – Buy/Sell entry zone
Red Line – Stop Loss zone
Green, Yellow, and Purple Lines – Take Profit levels (TP1, TP2, TP3)
This structured visualization enables traders to easily manage trades and maintain consistent risk-to-reward ratios without manual calculations.
How to Trade Using the Dinapoli Targets Indicator for MT5
Once installed, the Dinapoli Targets Indicator automatically scans the chart for recent price swings and plots the Dinapoli levels. Here’s how you can trade using it effectively:
Identify the Setup:
Watch for the price approaching the white dotted line, which acts as a potential buy or sell entry zone.
Confirm with Price Action:
Before entering a position, look for candlestick confirmation, such as a bullish engulfing pattern for buys or a bearish engulfing pattern for sells.
Set Stop Loss and Targets:
Place the stop loss just beyond the red line.
Set take profits at the green, yellow, and purple lines (TP1, TP2, TP3) depending on your trading style.
Multi-Timeframe Advantage:
The indicator can be applied to any timeframe.
However, zones drawn on higher timeframes (H4, D1) are generally more reliable for swing and position traders.
This indicator works particularly well when combined with trend-following systems or momentum indicators, providing a powerful trading confluence.
Best Strategies with Dinapoli Targets Indicator
1. Intraday Trading Setup
Apply the indicator on M15 or M30 charts.
Trade when the price touches the entry line with a confirmation candle.
Book partial profits at TP1 and let the rest run toward TP2 or TP3.
2. Swing Trading Strategy
Use the H4 or Daily timeframe.
Wait for major price pullbacks to touch the white line.
Confirm the setup with indicators like RSI or MACD for better accuracy.
3. Scalping with Dinapoli Targets
Ideal for fast-paced traders who monitor M1–M5 charts.
Trade small reversals using tight stop-loss and quick profit-taking at TP1.
Advantages of the Dinapoli Targets Indicator for MT5
Automatic Fibonacci Levels – No manual plotting required.
Clear Buy/Sell Zones – Visually intuitive entry and exit levels.
Adaptable to All Timeframes – Works for scalping, day trading, and swing trading.
Supports All Assets – Use on Forex, commodities, indices, and crypto.
Beginner-Friendly Interface – Simple color-coded guidance.
By combining Fibonacci logic with dynamic Support And Resistance, the Dinapoli Targets Indicator empowers traders to make more objective trading decisions.
Conclusion
The Dinapoli Targets Indicator for MT5 is a must-have for traders seeking automated Fibonacci-based trading levels. It visually marks potential entry zones, stop loss, and take-profit areas, allowing traders to plan trades with precision.
However, it’s always best to confirm entries using price action or other indicators for higher accuracy.
👉 Download the Dinapoli Targets Indicator for MT5 for free at IndicatorForest.com and start trading with structured precision today.
FAQ
6 Downloads
Published:
Nov 10, 2025 23:45 PM
Category: