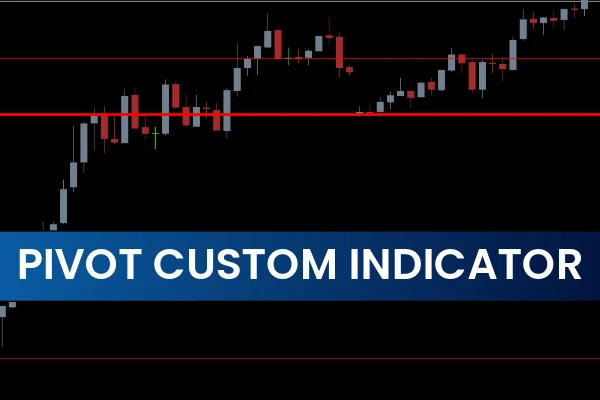
The Pivot Custom Indicator for MT4 is a vital technical tool for forex traders seeking reliable Support And Resistance levels. This indicator automatically calculates and plots pivot levels for multiple timeframes directly on the current chart, helping traders make informed trading decisions. With clearly defined support (S1, S2, S3) and resistance (R1, R2, R3) levels, the Pivot Custom Indicator allows both novice and experienced traders to identify high-probability buy and sell zones.

Pivot trading is a popular method among forex traders because it closely resembles traditional support and resistance strategies. By using pivot points, traders can anticipate market direction, confirm breakouts, and manage trade entries and exits more effectively.
What Is the Pivot Custom Indicator for MT4?
The Pivot Custom Indicator is a calculation-based tool that automatically plots pivot levels on any chart. The key features include:
Mid Pivot Line: Plotted in light blue for easy identification of market bias
Resistance Levels (R1, R2, R3): Plotted in red to indicate potential selling zones
Support Levels (S1, S2, S3): Plotted in blue to identify potential buying zones
The indicator works on all intraday timeframes as well as daily, weekly, and monthly charts, making it versatile for Scalping, intraday, or swing trading.
How to Trade Using the Pivot Custom Indicator
Bullish Trading Strategy
When the price moves above the pivot point:
It indicates a potential bullish trend.
Traders can enter buy trades near support levels (S1, S2, S3).
Target profits at higher pivot or resistance levels (R1, R2, R3).
Place stop-loss below the pivot point to limit losses in case the trend reverses.
Bearish Trading Strategy
When the price falls below the mid pivot:
It signals a potential bearish trend.
Traders can enter sell trades near resistance levels (R1, R2, R3).
Target profits at lower support levels (S1, S2, S3).
Place stop-loss above the pivot point to protect against sudden reversals.
Advanced Pivot Trading: Using R3 and S3 Levels
The R3 and S3 levels are particularly useful for spotting overbought and oversold conditions.
Sell at R3: When the price reaches R3, it may reverse downward after overextending.
Buy at S3: When the price hits S3, it may bounce back, providing a profitable long trade.
This strategy allows traders to capture entire retracement moves for significant gains while minimizing risk.
Benefits of Using the Pivot Custom Indicator
Automatic Level Calculation: No need to manually identify pivot points.
Clear Visual Signals: Midline, support, and resistance levels are color-coded for ease.
Multi-Timeframe Compatibility: Works across intraday, daily, weekly, and monthly charts.
Trading Versatility: Useful for breakout, reversal, and retracement trading strategies.
User-Friendly: Suitable for beginners while providing enough depth for advanced traders.
By integrating the Pivot Custom Indicator with other tools like trendlines, channels, or candlestick patterns, traders can improve signal accuracy and avoid false breakouts.
Conclusion
The Pivot Custom Indicator for MT4 is an essential tool for forex traders looking to combine support and resistance levels with pivot trading strategies. It allows traders to spot high-probability buy and sell zones, optimize entry and exit points, and manage risk effectively. The indicator is free to download and easy to install, making it a must-have addition to any technical trader’s toolkit. For more premium trading tools and free indicators, visit IndicatorForest.com today.
FAQ
2 Downloads
Published:
Nov 20, 2025 00:07 AM
Category: