The Camarilla Points Indicator for MT5 is a powerful support and resistance tool that helps traders identify key market turning points with remarkable accuracy. Derived from the classic Camarilla Equation developed by Nick Scott, this indicator uses the previous day’s high, low, and close to calculate Support And Resistance zones. However, the MT5 version enhances the traditional formula by including 10 distinct levels, many of which are based on Fibonacci ratios, making it more precise than standard pivot point systems.
Traders use the Camarilla Points Indicator to detect potential breakout areas, trend continuation points, and reversal zones. Whether you are a swing trader, intraday trader, or Price Action enthusiast, this indicator provides a clear structure for understanding market behavior. For more high-quality tools, visit IndicatorForest.com.
What Is the Camarilla Points Indicator?
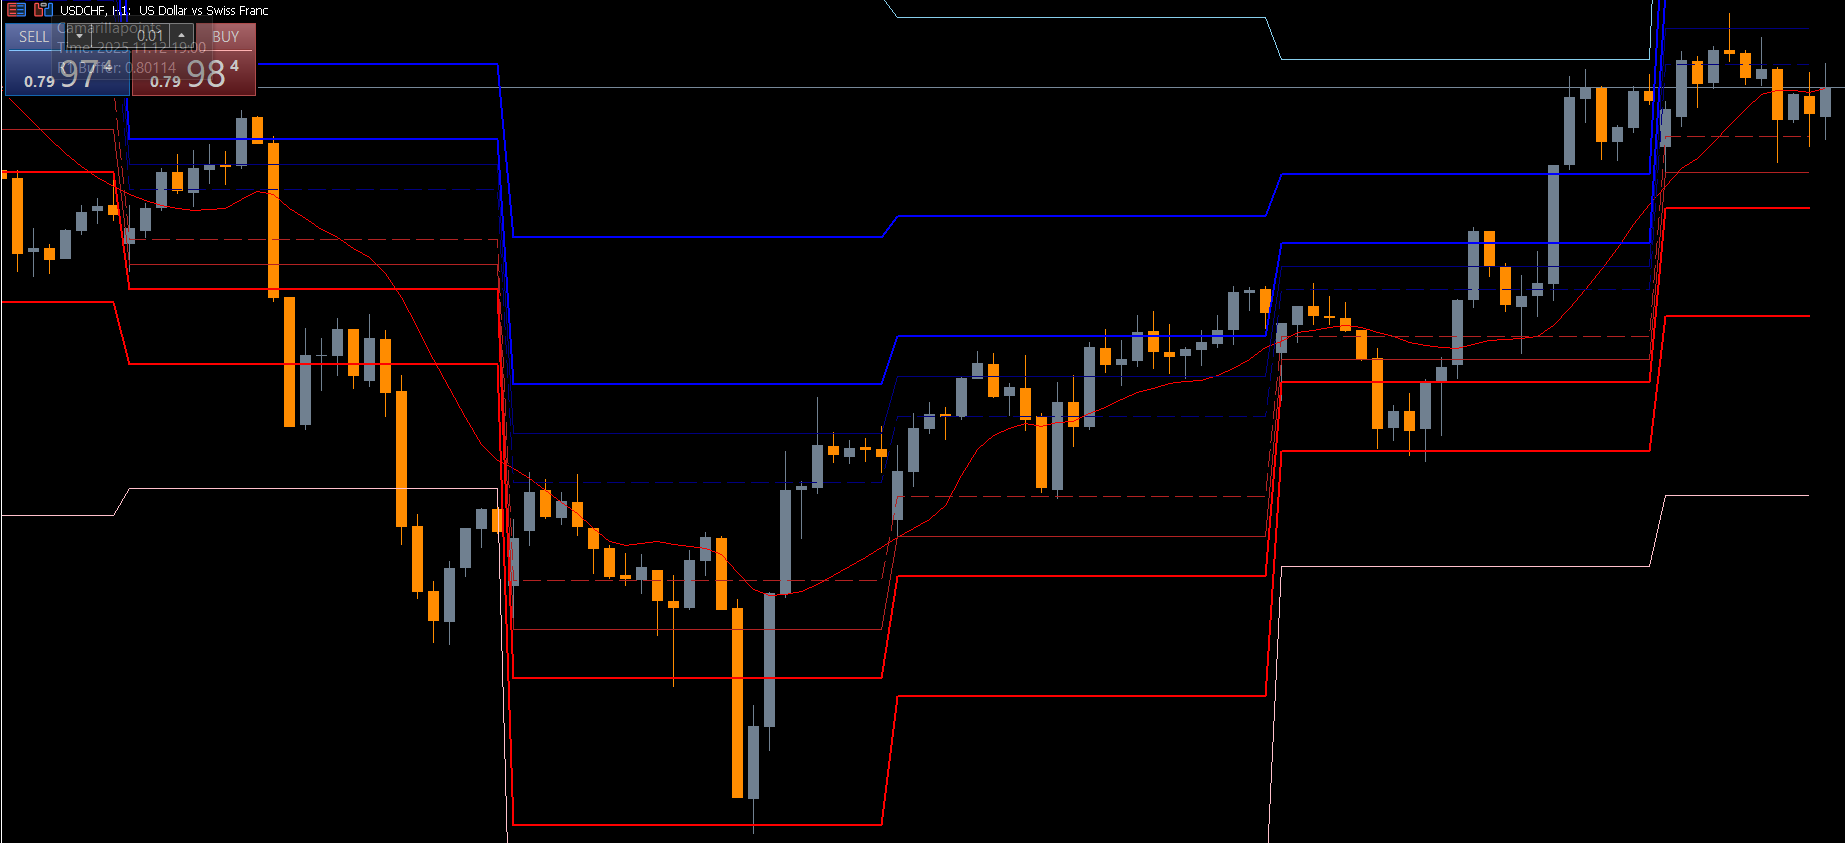
The Camarilla Points Indicator is an upgraded version of classic pivot levels. Instead of offering only a few key levels, it provides a complete structure of 10 support and resistance lines—five above price and five below it. These levels represent:
Resistance Lines (H1–H5)
Support Lines (L1–L5)
Central pivot levels for equilibrium
The top levels act as resistance zones where price may reverse, while the bottom levels serve as support where new bullish opportunities may emerge.
Why Fibonacci-Based Levels Matter
Many traders prefer the Camarilla system because its use of Fibonacci calculations creates natural levels that align with market psychology. These levels:
Identify where traders take profit
Highlight zones of reversal
Help traders anticipate breakout momentum
When the price breaks above the top Fibonacci resistance level, it suggests a strong downtrend is forming, as sellers may re-enter the market. Conversely, when price breaks below the lower Fibonacci support line, it suggests a strong uptrend is developing.
Best Timeframes for Using Camarilla Points
Although the indicator functions on all timeframes, it performs best on:
H1
H4
Daily (D1)
Lower timeframes such as M1 or M5 tend to create frequent false signals due to noise and intraday volatility. Higher timeframes provide cleaner, more reliable Camarilla levels.
Camarilla Points Indicator BUY/SELL Signals
The USD/JPY M15 chart in the example highlights how the indicator generates BUY and SELL signals. Understanding how to trade these levels is essential for maximizing your strategy.
BUY Signals
A BUY trade is considered when:
Price approaches or touches the lower Camarilla support line (L3–L5)
The market shows signs of bullish rejection or reversal patterns
Price fails to close below the support zone
Traders place BUY orders above support with stop-losses below the lower Camarilla line.
SELL Signals
A SELL trade becomes possible when:
Price reaches the upper Camarilla resistance lines (H3–H5)
A reversal candle forms near the resistance zone
Momentum weakens as price struggles to break the upper levels
Sell orders are placed below resistance with stop-losses above the highest Camarilla level.
Trading Tips for Better Accuracy
Wait for Price Action Confirmation
Although the indicator offers clear levels, it is wise to wait for:
Bullish/bearish engulfing patterns
Pin bars
Double tops or double bottoms
This prevents entering too early on weak signals.
Use Additional Indicators
To improve accuracy, combine Camarilla Points with:
RSI – to identify overbought/oversold conditions
MACD – to confirm trend direction
ADX – to detect strength of a breakout
Avoid Low-Volatility Sessions
Camarilla levels are more accurate when the market has enough momentum, such as during:
London session
New York session
Major news events
Conclusion
The Camarilla Points Indicator for MT5 is a highly effective analytical tool for identifying support, resistance, breakout zones, and reversal signals. Its Fibonacci-based structure offers traders a unique advantage, helping them interpret price movements more precisely. Whether used for breakout strategies or trend reversals, the Camarilla system is a reliable addition to any trader’s toolkit.
Download the Camarilla Points Indicator and explore more high-quality MT4 and MT5 tools at IndicatorForest.com.
FAQ
2 Downloads
Published:
Nov 19, 2025 03:39 AM
Category: