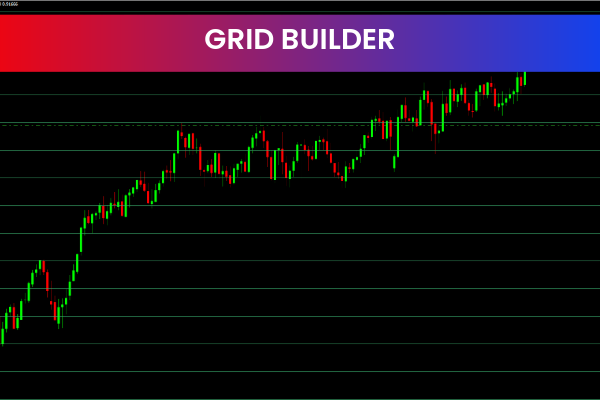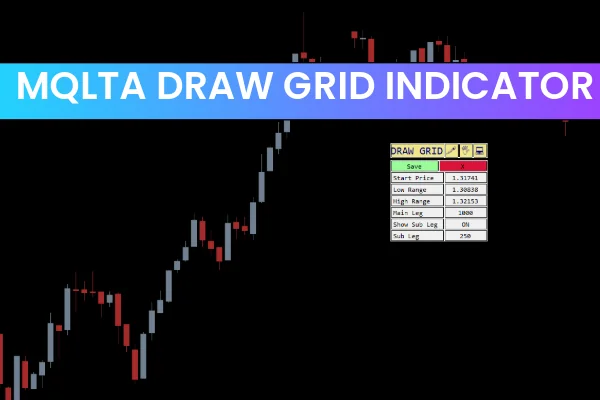
The MQLTA Draw Grid Indicator for MT4 is a simple yet powerful tool designed to plot dynamic grid levels on your MetaTrader 4 charts. These grid lines act as support and resistance zones, making it easier for traders to identify key price levels and place accurate market entries.
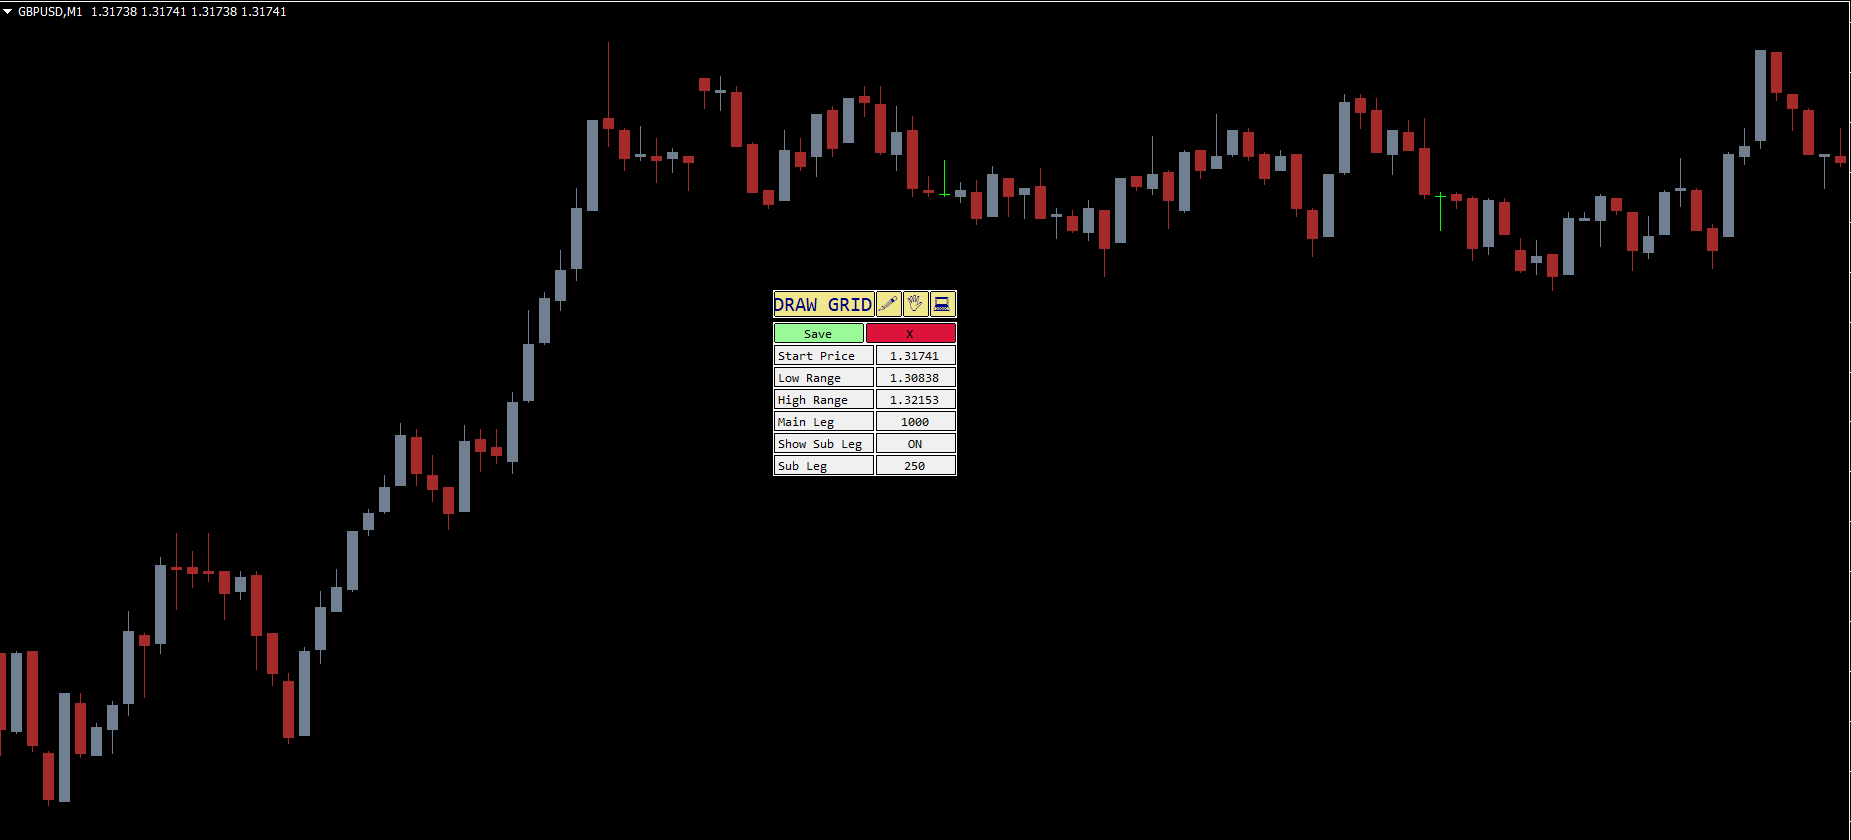
Once applied to the chart, the indicator presents an interactive options panel that allows traders to draw the grid instantly. The panel shows helpful information such as the current level’s starting price, the high/low range, and the leg being analyzed.
Although the indicator works on all timeframes, it performs best on H1 and higher, where market structure is clearer and grid levels provide more reliable signals.
What Is the MQLTA Draw Grid Indicator?
The MQLTA Draw Grid Indicator automatically creates a structured grid on the chart, dividing Price Action into multiple horizontal levels. These zones represent repeating high and low levels, which help traders visualize market behavior and spot potential turning points.
Because Support And Resistance levels form the foundation of technical analysis, this indicator becomes an essential tool for traders who rely on price action, breakout strategies, or level-based systems.
How the Grid Lines Help Traders
Each grid line represents an important decision point in the market:
Upper grid levels → potential resistance zones
Lower grid levels → potential support zones
Middle grid levels → areas of indecision or consolidation
The indicator’s grid layout helps traders avoid emotional trading by giving them clear, predefined price levels to monitor.
Using the MQLTA Draw Grid Indicator Options Panel
When you activate the indicator, the options panel will display key data:
Starting price of the current level
High and low range values
Leg direction and measurements
This data helps traders better understand how price is interacting with the grid structure. It also provides deeper insight into range boundaries and potential reversal zones.
How to Trade the MQLTA Draw Grid Indicator – BUY/SELL Signals
The EUR/USD H1 example demonstrates how BUY and SELL signals are generated when the price interacts with grid levels.
SELL Signal
A SELL signal is triggered when:
Price moves above the upper grid level,
And then shows rejection or bearish movement.
This indicates that the upper grid line is acting as a strong resistance zone.
BUY Signal
A BUY signal is triggered when:
Price moves below the lower grid level,
And then reverses or forms a bullish pattern.
This suggests that the lower grid line is acting as a strong support zone.
When to Avoid Taking Trades
Avoid entries when price is fluctuating between middle grid levels, as this usually signals market indecision. Trading in these zones may lead to false breakouts or choppy performance.
Best Indicators to Combine With
For improved accuracy, combine the MQLTA Draw Grid Indicator with:
RSI (momentum confirmation)
MACD (trend confirmation)
Moving Averages (trend bias)
Price Action signals (candlestick confirmations)
This ensures stronger confluence and reduces the chances of false signals.
Advantages of the MQLTA Draw Grid Indicator
Automatically draws multiple price levels
Displays real-time high/low range and level data
Works on all pairs and timeframes
Ideal for swing and day trading
Perfect for level-based, breakout, and reversal strategies
Beginner-friendly and easy to apply
Conclusion
The MQLTA Draw Grid Indicator for MT4 is an excellent tool for traders who rely on support and resistance to guide their trading decisions. By identifying upper and lower grid levels, traders can confidently place BUY or SELL orders based on clear price interaction.
You can download the MQLTA Draw Grid Indicator for MT4 for free from IndicatorForest.com and start improving your chart analysis today.
FAQ
2 Downloads
Published:
Nov 14, 2025 21:15 PM
Category: