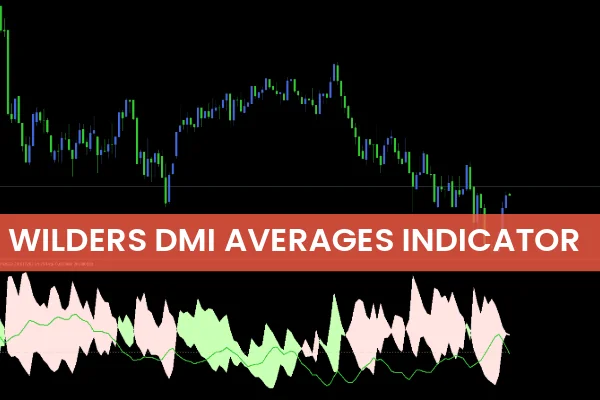
The Wilders DMI Averages Indicator is a powerful trend analysis tool used by traders to measure the strength and direction of price movements. Found on most trading platforms, this indicator is built upon the concept of Directional Movement Index (DMI) developed by J. Welles Wilder. The Wilders DMI helps traders identify whether an asset is trending up or down and how strong that trend really is — making it an essential component of both forex and stock trading strategies.
At IndicatorForest.com, traders can download and explore the Wilders DMI Averages Indicator to enhance their trading decisions with confidence and clarity.
How the Wilders DMI Averages Indicator Works
The indicator is made up of two lines — a green (+DI) and a yellow (-DI) — along with a histogram displayed below the main price chart.
The green (+DI) line shows when price momentum is rising, suggesting potential bullish opportunities.
The yellow (-DI) line indicates when momentum is falling, signaling possible bearish conditions.
The histogram represents the Trend Strength — the higher it rises above level 20, the stronger the trend.
When analyzed together, these elements give traders insights into when to enter or exit a trade, as well as the overall volatility of the market.
Understanding Wilders DMI Averages BUY / SELL Signals
Knowing when to open a trade is crucial. The Wilders DMI Averages Indicator helps identify strong buying or selling signals based on the relationship between the +DI and -DI lines and the histogram values.
Buy Signal
A buy signal occurs when the green line (+DI) crosses above the yellow line (-DI).
A strong buy is confirmed when the histogram bars rise above the 20 level and are lime-colored, showing strong bullish momentum.
This setup indicates that the market is in a clear uptrend, making it a good opportunity to go long.
Sell Signal
A sell signal appears when the yellow line (-DI) crosses above the green line (+DI).
When the histogram is above 20 and pink in color, it signals a strong bearish trend.
This is a sign to open a short position or prepare for potential downside movement.
Exit Signal
When the two lines cross again — whether from bullish to bearish or vice versa — it indicates a Trend Reversal. At this point, traders should consider closing their position or adjusting their strategy accordingly.
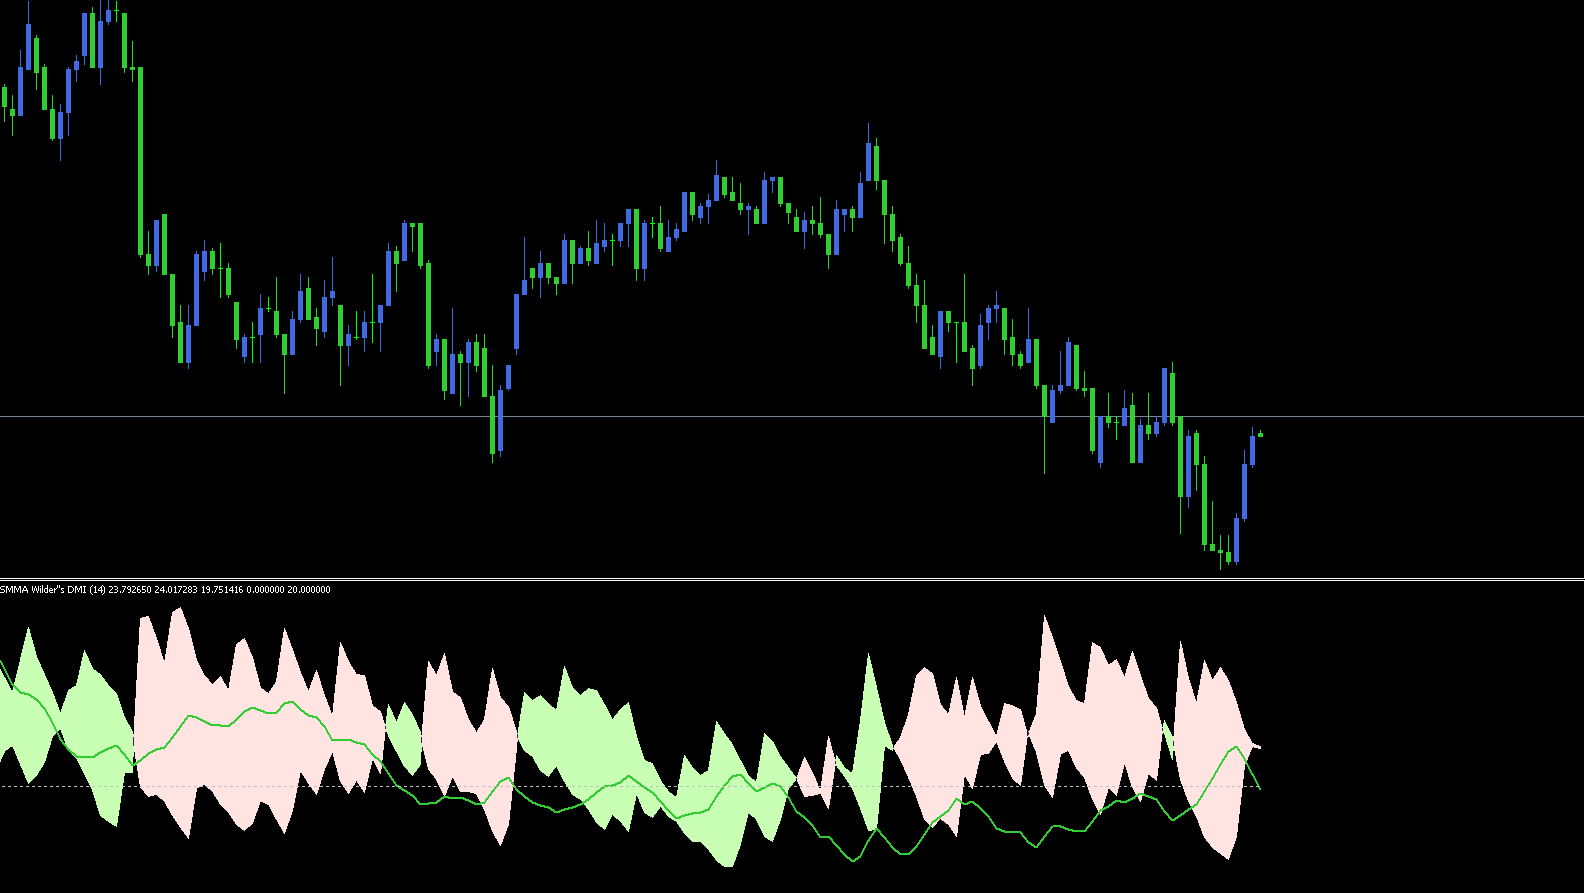
Real Market Example
Consider the EUR/USD hourly chart as an example. When the green line moves above the yellow line, it signifies that the pair is entering an uptrend. If the histogram is above level 20 and colored lime, it confirms a strong bullish signal — a perfect time to enter a buy trade.
As price continues upward, traders can ride the trend confidently. Later, when the histogram changes to a pink shade and the yellow line crosses back above the green line, this signals that the market may be reversing. That’s when it’s best to close the buy position and look for short opportunities.
Why Traders Use Wilders DMI Averages
The Wilders DMI Averages Indicator is a versatile trading tool suitable for:
Long-term and short-term traders
Novice and experienced investors
Any timeframe or asset class (forex, stocks, commodities, crypto)
It not only shows trend direction but also trend strength and volatility, offering traders more confidence in identifying market entry and exit points.
By combining the Wilders DMI with other indicators such as Moving Averages, ADX, or RSI, traders can create even more reliable strategies for consistent results.
Conclusion
The Wilders DMI Averages Indicator is an invaluable technical analysis tool for identifying both trend direction and
intensity. By observing the interactions of the +DI and -DI lines along with the histogram, traders can make more informed decisions on when to enter, hold, or exit trades.
To get the Wilders DMI Averages Indicator and explore other advanced tools, visit IndicatorForest.com — your trusted source for high-quality MT4/MT5 trading indicators.
Published:
Nov 04, 2025 04:10 AM
Category: