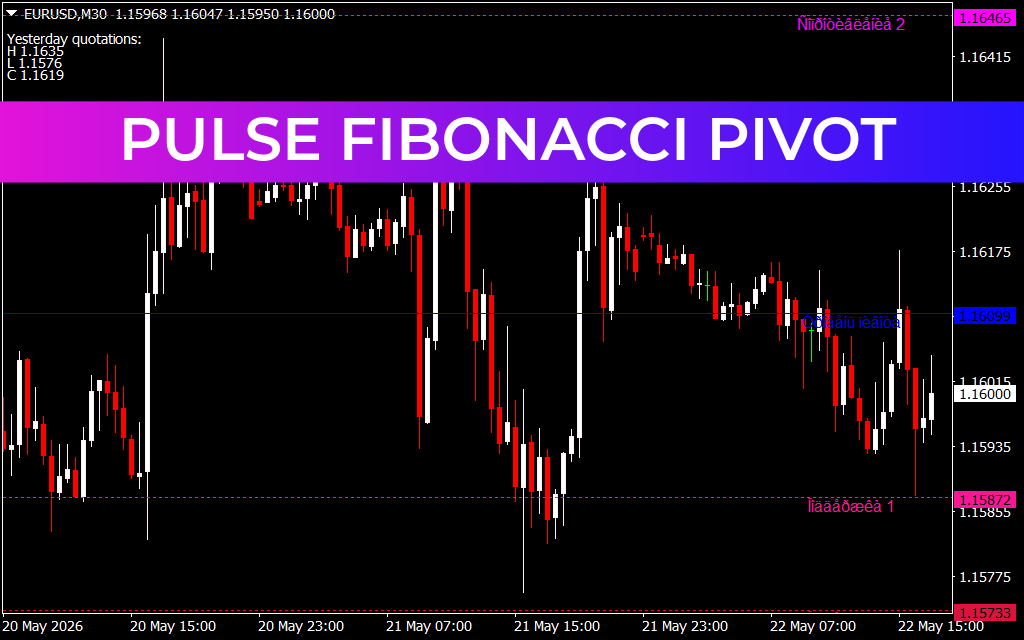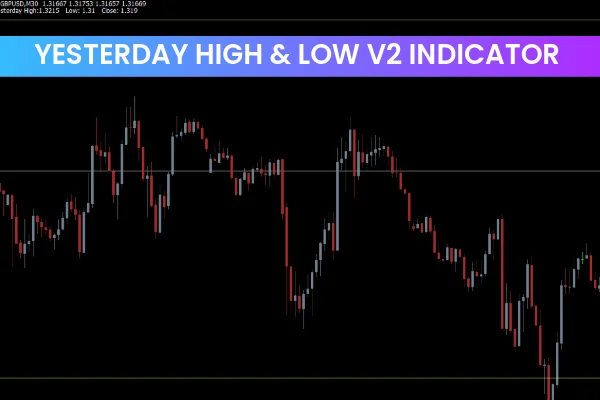
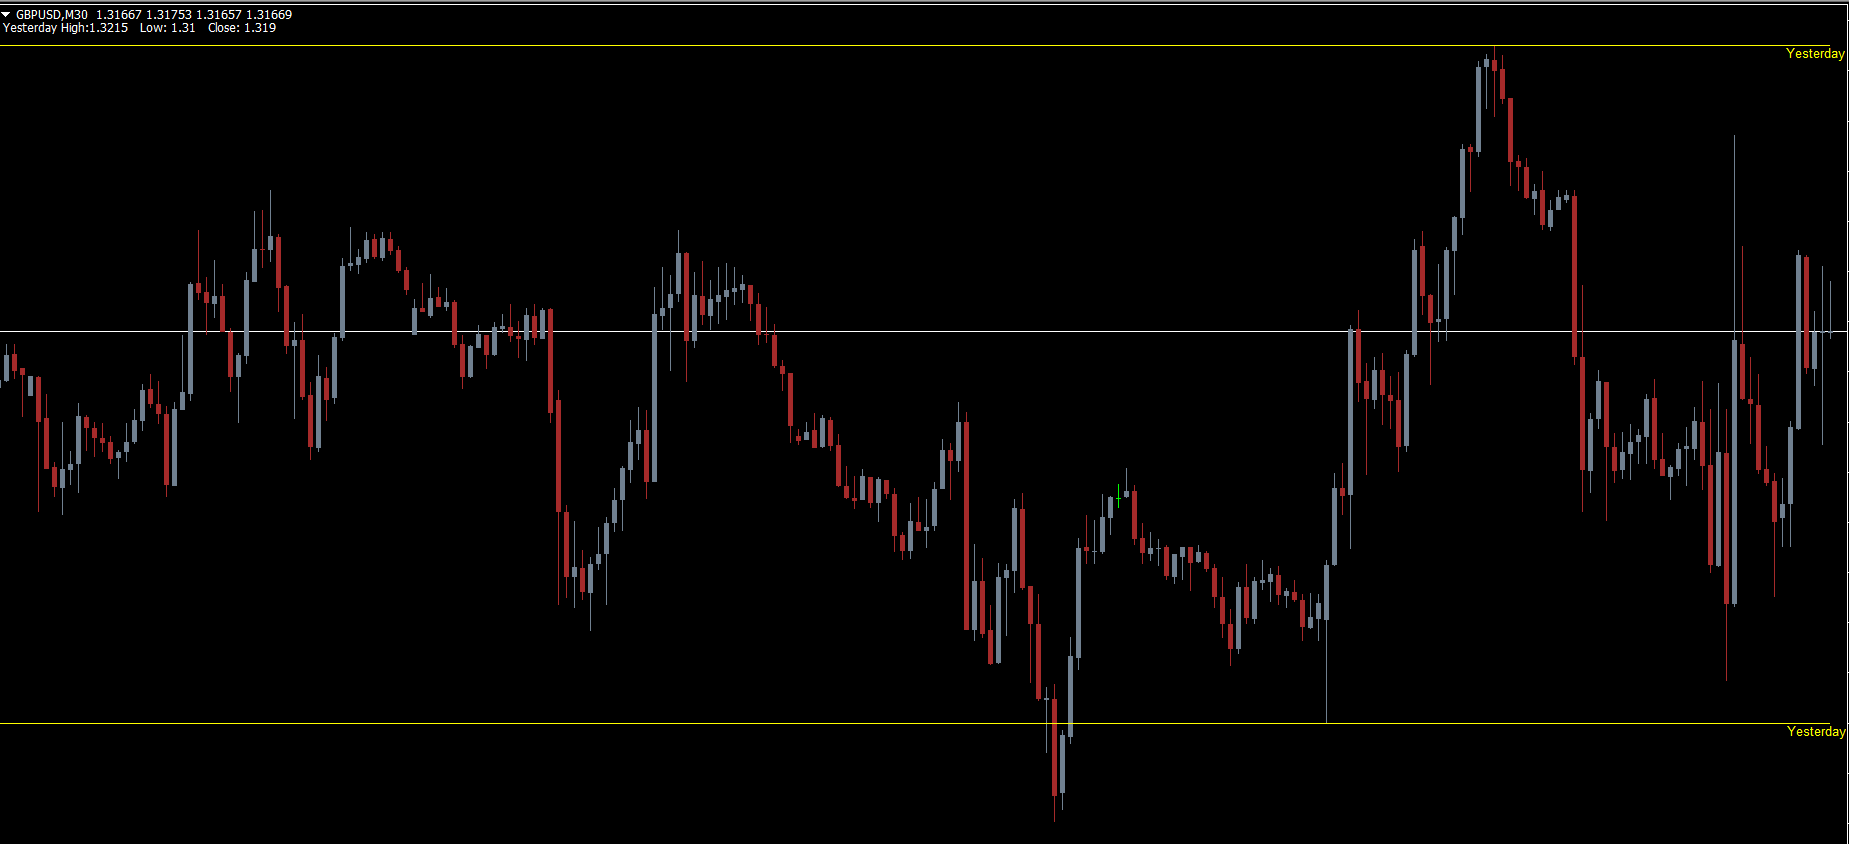
The Yesterday High & Low V2 Indicator for MT4 is a highly effective price-action tool that helps traders quickly identify key Support And Resistance levels based on the previous trading day. These levels—yesterday’s high and yesterday’s low—are widely used by professional Forex traders to anticipate breakouts, reversals, and intraday volatility. With clean horizontal lines and clear comments displayed in yellow, this indicator simplifies decision-making for both beginners and advanced traders.
Whether you scalp, day trade, or swing trade, the Yesterday High & Low V2 Indicator gives you a reliable framework for planning trades throughout the trading day. It works on all MT4 timeframes, making it a flexible and universal tool for Forex traders seeking precision.
How the Yesterday High & Low V2 Indicator Works
The indicator automatically identifies the previous day’s high and low prices and projects them as horizontal levels on every timeframe. These levels act as immediate support and resistance zones. Traders rely on them to assess whether the market may attempt to break the highs/lows or reverse from them.
The plotted lines remain static throughout the trading day, serving as reference points for breakout trading, retests, and failure-based entries. Since these levels are used by institutional traders as liquidity pools, they often trigger strong moves when price interacts with them.
Why Yesterday's High and Low Matter in Forex Trading
Yesterday’s high and low are among the most respected Market Structure levels because:
They represent the previous day’s extreme price points
Liquidity often rests above the high and below the low
Many breakout algorithms and trading bots monitor these levels
Traders can expect strong reactions: breakouts, fakeouts, or rejections
The Yesterday High & Low V2 MT4 Indicator places these levels directly on your charts, eliminating the need to calculate or draw them manually.
Yesterday High & Low V2 Indicator – Trade Setups
Below are the core trade signals commonly used with this indicator:
Breakout Strategy (BUY Signal)
If price breaks above yesterday’s high, it indicates bullish momentum.
Entry: Buy after the breakout candle closes above the high.
Stop Loss: Place SL below the previous swing low.
Take Profit: Since the indicator does not include profit targets, traders may use fixed RR ratios or trailing stops.
Breakout Failure (SELL Signal)
If price fails to break the previous high and reverses:
Entry: Sell on bearish rejection candle.
Stop Loss: Above the failed breakout wick.
Breakdown Strategy (SELL Signal)
If price breaks below yesterday’s low, bearish continuation is likely.
Entry: Sell after a breakout close below the low.
Stop Loss: Above the last swing high.
Exit: Use risk-reward or momentum-based exit techniques.
Breakdown Failure (BUY Signal)
If price fails to break below the support and bounces:
Entry: Buy on bullish reversal candle.
Stop Loss: Below the rejection point.
These setups work exceptionally well for intraday traders who monitor volatility during London and New York sessions.
Benefits of Using Yesterday High & Low V2 for MT4
Automatically plots accurate support/resistance lines
Works on all MT4 timeframes
Suitable for beginners and experts
Helps identify breakouts, retests, and liquidity sweeps
Clear and easy-to-see line styling
Enhances any price-action trading strategy
Ideal for breakout traders and intraday systems
For even stronger signals, you can combine this indicator with oscillators like RSI or MACD to confirm momentum.
Conclusion
The Yesterday High & Low V2 Indicator for MT4 is one of the simplest yet most powerful tools for intraday Forex trading. By plotting the previous day’s high and low on every timeframe, it helps traders anticipate breakouts, reversals, and liquidity-based moves with far better accuracy. Whether you prefer breakout strategies or failure-based entries, this indicator gives you a reliable market framework.
➡ Download the indicator for FREE now at IndicatorForest.com and improve your trading strategy instantly.
FAQ
3 Downloads
Published:
Nov 14, 2025 09:42 AM
Category: