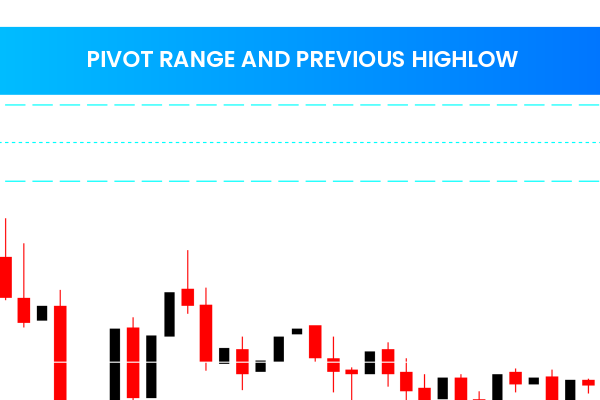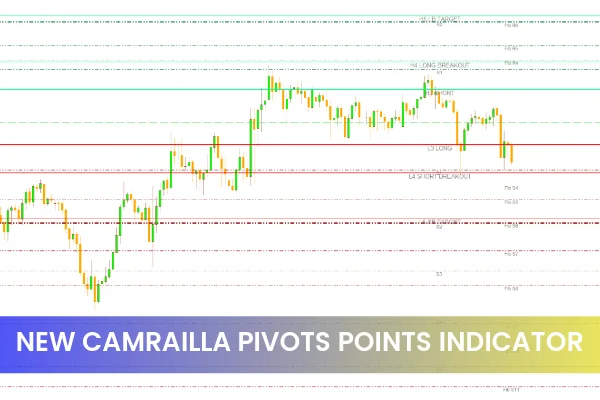
The New Camarilla Pivot Points Indicator is a powerful trading tool that helps traders determine multiple Support And Resistance levels on the chart. Based on a mathematical formula using the previous day’s high, low, and closing prices, it enables traders to predict potential market turning points more effectively.
Unlike standard pivot indicators, this version integrates Fibonacci ratios into the calculation, offering an advanced framework for technical analysis and precise market timing. This makes it a must-have tool for MT4 users seeking accurate signals and improved risk management.
How the New Camarilla Pivot Points Are Calculated
The Camarilla Pivot Point formula calculates a central pivot point (PP) along with multiple layers of support (S1, S2, S3, S4) and resistance (R1, R2, R3, R4) levels.
These levels are derived mathematically from the previous trading session:
PP (Pivot Point) = (High + Low + Close) ÷ 3
Support and Resistance = Based on percentage multipliers of the previous range
The New Camarilla Indicator goes one step further by incorporating Fibonacci levels (such as 38.2%, 50%, and 61.8%) into these pivot ranges. This hybrid calculation provides a more dynamic and accurate structure for forecasting market reversals or continuations.
Why Use Fibonacci with Camarilla Pivot Points?
The integration of Fibonacci ratios enhances the precision of the traditional Camarilla system. These levels help highlight potential reversal zones with higher probability.
For instance:
A 61.8% Fibonacci retracement level overlapping with a Camarilla R3 can signal a strong resistance area.
A 38.2% retracement aligning with S2 may act as a strong buying zone.
This combination provides a dual confirmation approach — blending time-tested mathematical precision with natural market rhythm, helping traders reduce false signals and make more confident entries and exits.
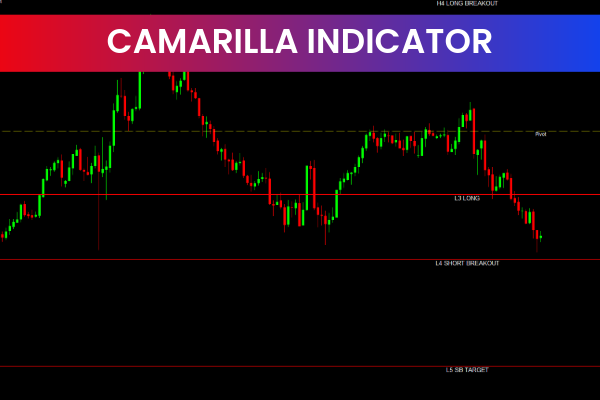
How to Use the New Camarilla Pivot Points Indicator for MT4
The New Camarilla Pivot Points Indicator for MT4 can be easily applied to any forex chart, such as USD/JPY or EUR/USD.
On the USD/JPY H4 chart, for example:
When the price breaks above a resistance level, it indicates a bullish breakout signal.
When the price breaks below a support level, it’s a bearish breakout signal.
Alternatively, traders can use bounces rather than breakouts:
If the price touches a support level and bounces higher, it suggests a buying opportunity.
If the price reaches resistance and falls lower, it indicates a selling setup.
For maximum accuracy, combine this indicator with trend confirmation tools such as moving averages or RSI indicators.
Practical Tips for Traders
Timeframes: Works best on H1 and H4 charts.
Pairs: Effective on major currency pairs, commodities, and indices.
Strategy: Use in confluence with Price Action and volume indicators to validate entries.
Conclusion
The New Camarilla Pivot Points Indicator for MT4 is a modernized version of the traditional Camarilla Pivot system. By adding Fibonacci levels to the standard support and resistance calculation, it offers traders more insight into price reversals, continuation zones, and optimal entry levels.
If you want to trade smarter using precision-based pivots, download the New Camarilla Pivot Points Indicator today at IndicatorForest.com — your trusted source for premium MT4 and MT5 tools.
6 Downloads
Published:
Nov 04, 2025 00:27 AM
Category: