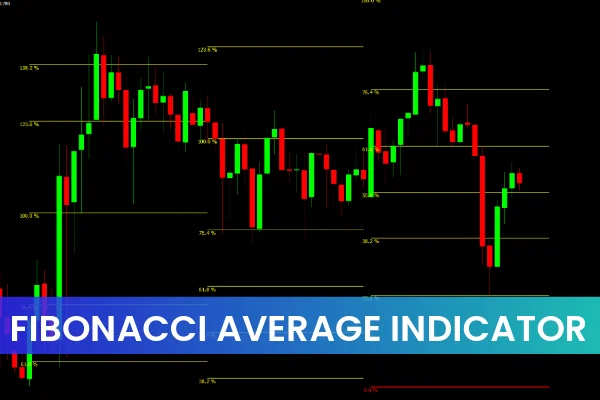
The Fibonacci Average Indicator for MT4 is a powerful analytical tool that combines Fibonacci retracement concepts with moving average logic. It helps traders identify potential entry and exit zones based on price clusters and Fibonacci levels that remain consistent across different timeframes. Unlike standard Fibonacci retracements that change as you switch timeframes, the Fibonacci Average Indicator maintains its structure, making it a reliable reference for trend continuation and reversal setups.
At IndicatorForest.com, you can find professional-grade MT4 indicators designed to simplify your trading process and enhance technical accuracy.
Understanding Fibonacci Levels in Trading
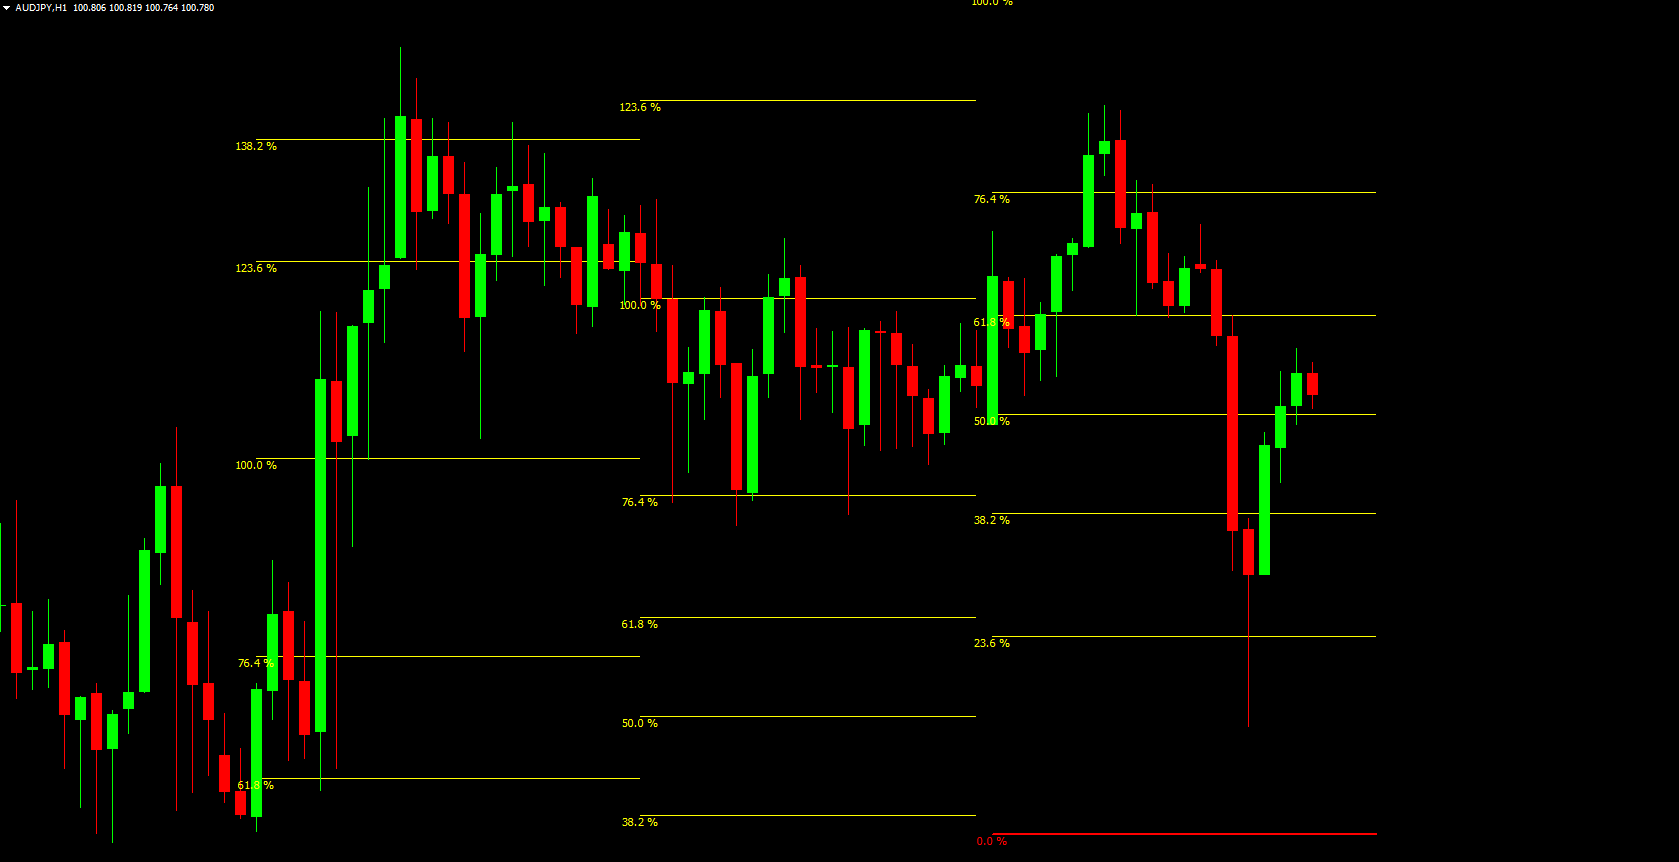
Fibonacci levels are derived from a mathematical sequence that naturally occurs in various aspects of life — and markets are no exception. Common retracement levels include 23.6%, 38.2%, 50%, 61.8%, and 78.6%, which traders often use to predict potential price pullbacks during a trend.
The Fibonacci Average Indicator for MT4 automatically plots multiple levels between 0% and 100%, providing a dynamic range where Price Action often reacts. These zones act as Support And Resistance, allowing traders to pinpoint high-probability trade entries and exits.
How to Use the Fibonacci Average Indicator for MT4
Identify the Trend Direction
Start by determining whether the market is trending upward or downward. The indicator’s Fibonacci levels align with the direction of the prevailing trend, helping you locate pullback or breakout areas.
Spot Fibonacci Clusters
Look for clusters of Fibonacci levels, as these represent strong potential reversal zones. When several Fibonacci lines converge, it often indicates that many traders are watching the same price area — increasing the likelihood of a reaction.
Wait for Confirmation
After identifying a Fibonacci cluster, wait for a reversal candlestick pattern such as a hammer, engulfing candle, or pin bar. These patterns confirm the validity of the zone and signal a possible Trend Reversal.
Manage Your Trades
Entry Point: Enter near Fibonacci clusters when confirmation occurs.
Exit Point: Exit when the price reaches the next Fibonacci cluster or starts consolidating.
Stop Loss: Place stops beyond the outer Fibonacci levels (0% or 100%) for better protection.
The 0% and 100% levels are especially important — they represent the start and potential completion of a price wave. Monitoring them helps you ride the trend effectively while minimizing risk.
Advanced Tips for Using the Indicator
Combine with Other Indicators: Use the Fibonacci Average Indicator alongside RSI, MACD, or moving averages to filter false signals.
Multiple Timeframe Analysis: The indicator’s consistent levels make it excellent for multi-timeframe setups. Confirm signals on higher timeframes before entering on lower ones.
Backtesting: Always backtest the indicator’s performance on historical data to fine-tune your strategy.
Why Traders Choose the Fibonacci Average Indicator
The Fibonacci Average Indicator for MT4 simplifies complex chart analysis. Its consistent and visually clear Fibonacci zones make it suitable for both beginner and advanced traders. By maintaining identical levels across all timeframes, it eliminates confusion and improves trade timing accuracy.
For professional tools like this, visit IndicatorForest.com — your source for premium MT4 and MT5 indicators, trading systems, and scripts.
Conclusion
The Fibonacci Average Indicator for MT4 is not a standalone solution, but it’s an exceptional addition to any trading strategy. It helps identify high-probability zones for price reversals or trend continuations with greater precision. Combine it with price action analysis and momentum indicators to enhance your accuracy and profitability.
Take your trading to the next level — download professional MT4 indicators and explore tutorials at IndicatorForest.com.
1 Download
Published:
Nov 03, 2025 14:15 PM
Category: