Every price movement in the Forex market is driven by the ongoing battle between buyers and sellers. However, identifying the exact zones where these shifts occur isn’t always easy.
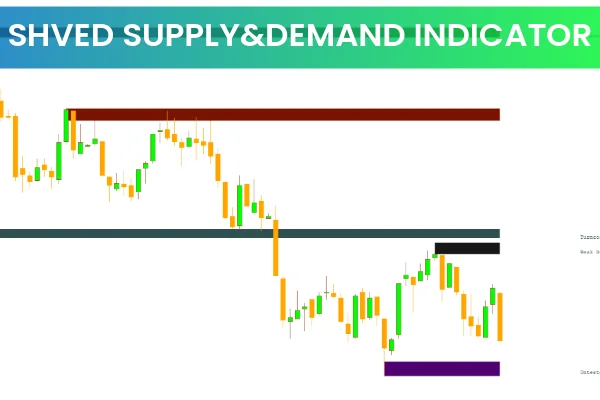
The Shved Supply & Demand Indicator for MT4 is a free, automated tool that highlights these critical Supply And Demand zones — areas where market activity significantly increases and price reversals or breakouts often begin.
By marking these zones visually, traders can better time their entries, exits, and trend reversals.
Description of the Shved Supply & Demand Indicator
The Shved Supply & Demand Indicator identifies and draws key market zones — areas where price has reacted strongly in the past due to an imbalance between buyers and sellers.
These zones are important because repeated interaction with them often reveals high-probability trade entry points.
How zones are formed:
Zones are drawn from areas where the price has previously made a strong directional move (up or down).
Zone height:
Depends on how actively the price reacted near that level — more reactions mean a taller and more significant zone.
Chart annotations:
The indicator labels each zone with short text descriptions to make interpretation simple.
Best timeframes:
Higher timeframes (H1, H4, D1) produce more reliable signals as they filter out market noise found on smaller timeframes.
Pro tip: The more times a level has been retested, the more valid and powerful it becomes.
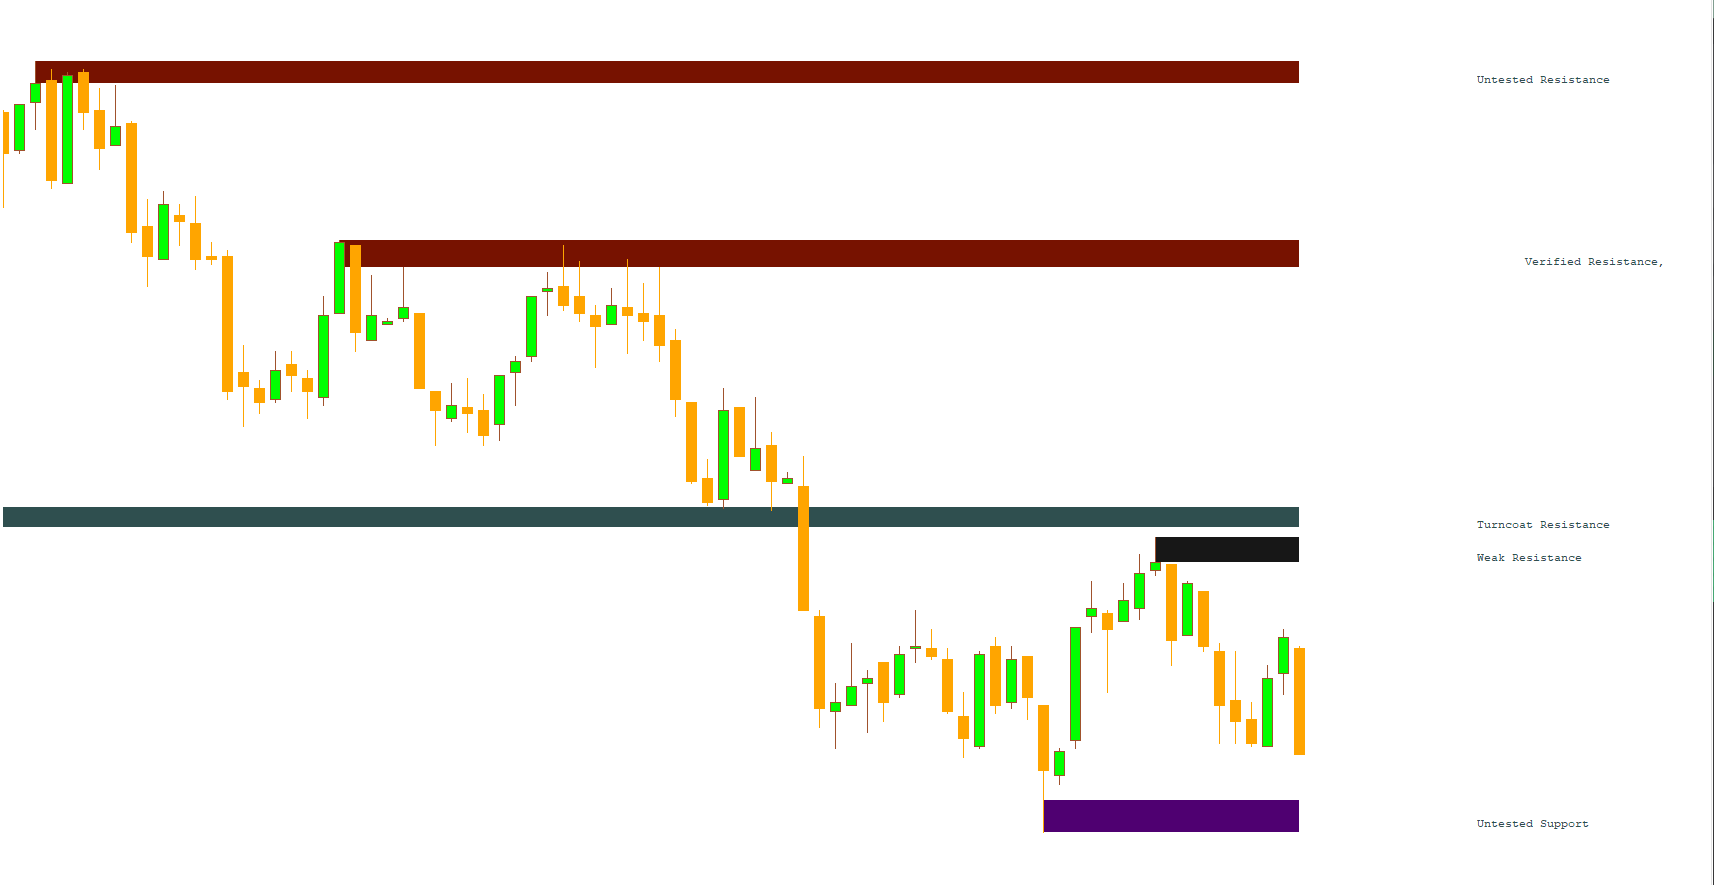
Types of Zones the Shved Supply & Demand Indicator Plots
The indicator identifies five distinct types of zones, each representing a different level of market significance:
Zone Type
Description
Weak Zone
Indicates minimal supply/demand imbalance. Avoid trading here or trade cautiously.
Untested Zone
Newly formed zone that triggered a strong price movement once. Await a retest before trading.
Verified Zone
Level that has been retested 2 or more times, showing renewed trading interest. The higher the retest count, the stronger the zone.
Proven Zone
Repeatedly tested level with consistent reactions. Often precedes major reversals or trend continuations.
Turncoat Zone
A “mirror” level — initially acted as support/resistance but later flipped roles after a breakout. Useful for trading reversals.
How to Use the Shved Supply & Demand Indicator
You can trade using the indicator in two main ways:
During trend reversals
In the direction of the main trend
Trading During a Trend Change
Example: A downtrend shifting into an uptrend.
First rally wave:
A strong upward price movement forms, creating an “Untested Zone.”
Retest:
Price returns to the level and bounces again — zone becomes “Verified.”
Third upward move:
Confirms potential Trend Continuation — zone becomes “Proven.”
Entry point:
Look for Buy entries when price revisits the zone.
Stop Loss:
Place just below the demand zone to protect against false breakouts.
Trading With the Main Trend
Example: A downtrend with temporary retracements.
The upward pullback is only a retracement within the downtrend.
When price forms a sell-off wave breaking below the last low, the zone becomes valid.
Look for Sell entries when price retests the proven zone.
Place Stop Loss above the supply zone.
Tips for Maximum Accuracy
Combine the indicator with other tools like Price Action, candlestick patterns, or trendline indicators for stronger confirmations.
Trade in the direction of the higher timeframe trend for improved reliability.
Pay attention to Turncoat zones, as they often signal strong reversals after breakouts.
Use tight Stop Loss just outside the zone for optimal risk/reward ratios.
Conclusion
The Shved Supply & Demand Indicator for MT4 is a powerful, free tool that helps traders visualize where key market imbalances occur.
By automatically drawing supply and demand zones, it simplifies the process of identifying entry and exit points, as well as trend reversals.
When used alongside Price Action or candlestick patterns, it significantly increases your odds of catching high-probability trades.
Whether you’re a scalper, day trader, or swing trader, this indicator can improve your technical analysis and make your trading decisions more objective.
Download the Shved Supply & Demand Indicator for MT4 now at IndicatorForest.com and start identifying key zones instantly.
FAQ
18 Downloads
Published:
Nov 10, 2025 11:28 AM
Category: