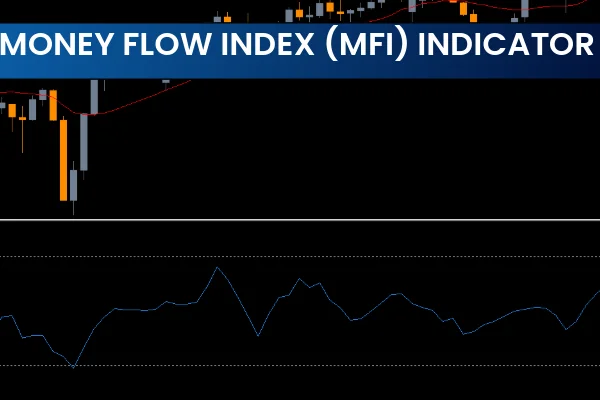
The Money Flow Index Indicator for MT5 is a powerful volume-based momentum oscillator that measures the inflow and outflow of money in any trading instrument. Unlike many traditional oscillators, the MFI uses both price and volume to determine overbought and oversold conditions. This makes it a more refined version of the classic RSI and valuable for traders who combine Price Action with market volume. The Money Flow Index Indicator for MT5 provides multiple technical signals, helping both beginners and advanced traders identify market reversals, trend continuations, divergence, and changes in market momentum.
What Is the Money Flow Index Indicator for MT5?
The MFI indicator calculates “money flow” by analyzing typical price and trading volume. The result is an oscillator that moves between 0 and 100, making it easy to visually assess momentum strength, exhaustion points, and potential turning zones.
Key characteristics include:
Volume-based momentum analysis
Clear overbought and oversold zones
Divergence and convergence signals
Applicable to all timeframes
Works across Forex, indices, commodities, and crypto
How the Money Flow Index Indicator for MT5 Works
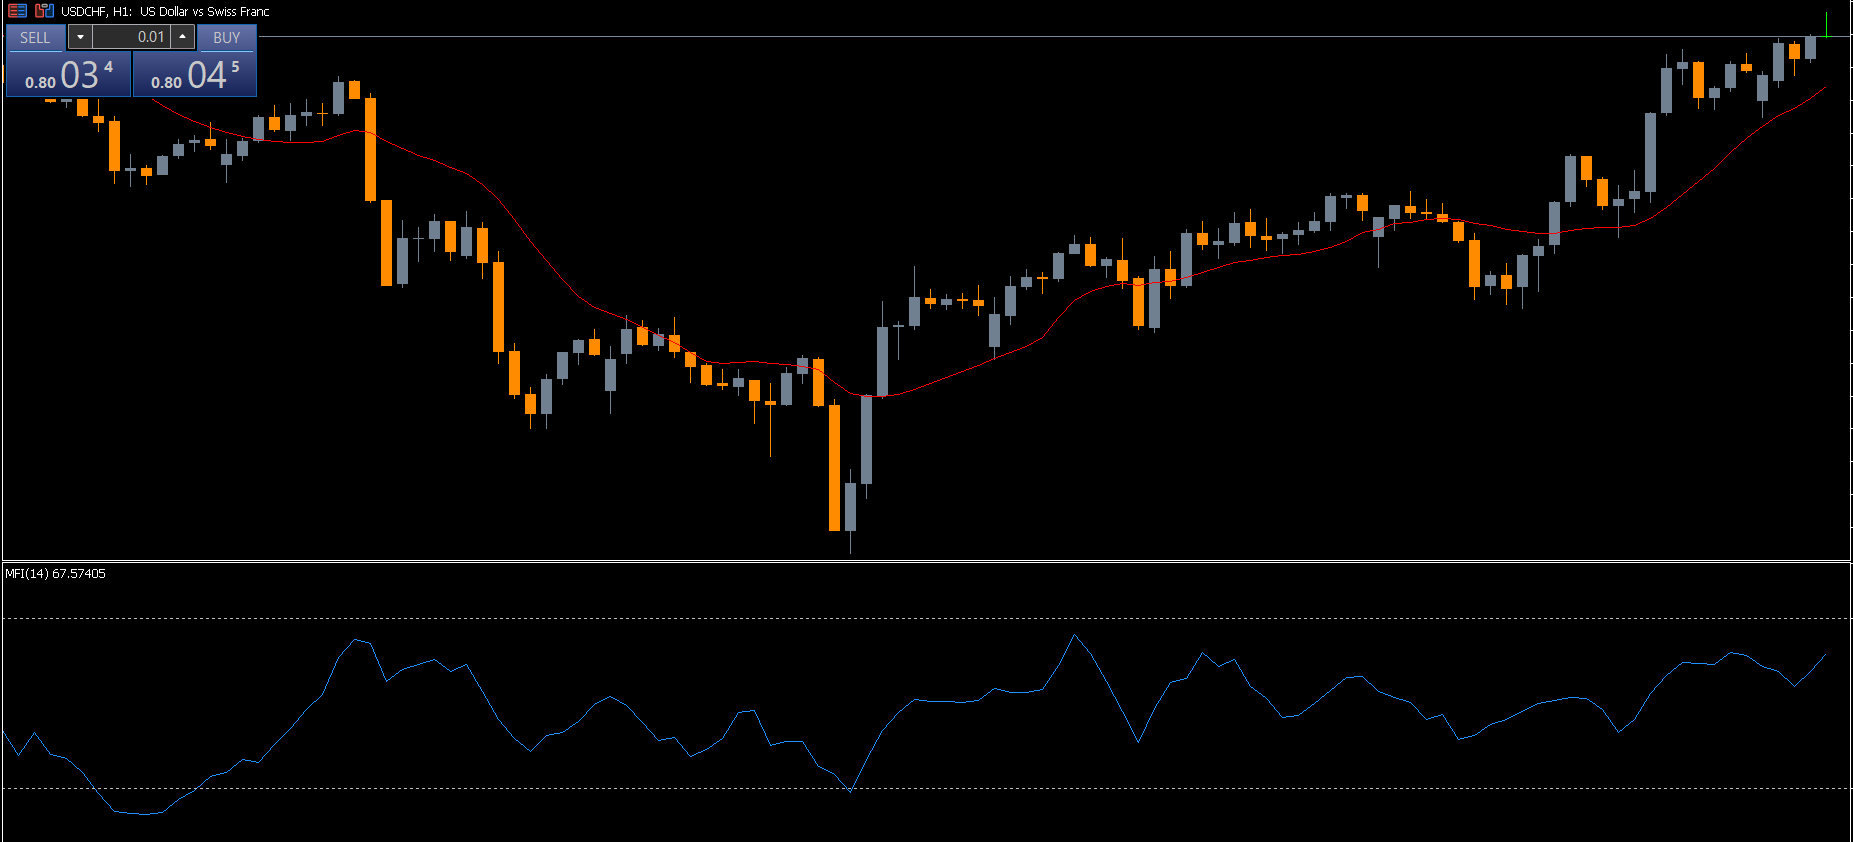
Overbought and Oversold Conditions
The indicator typically highlights:
Above 80 = Overbought Zone
Below 20 = Oversold Zone
When the MFI reaches these extreme levels, the indicator signals potential trend exhaustion.
For example:
If the MFI crosses 80, the market may soon turn bearish, offering a possible SELL setup.
If the MFI dips below 20, bullish momentum may return, offering a potential BUY setup.
These basic signals are simple but effective, especially for traders who prefer reversal strategies.
Trading the MFI Indicator for MT5 – Step-by-Step
Sell Signal (Overbought Zone)
When the MFI rises above 80:
Expect bearish reversal
Open a SELL position
Place stop loss above previous swing high
Take profit when price enters oversold territory or shows opposite momentum
Buy Signal (Oversold Zone)
When the MFI falls below 20:
Expect bullish reversal
Enter BUY position
Stop loss: below previous swing low
Take profit when the indicator signals overbought conditions
This method works well on H1, H4, and Daily charts, especially when combined with Candlestick Patterns.
Divergence and Convergence with the Money Flow Index
One of the strongest features of the Money Flow Index Indicator for MT5 is its ability to detect divergence.
Bearish Divergence
Occurs when:
Price makes higher highs
MFI makes lower highs
This suggests weakening momentum and a possible bearish reversal.
Trade Setup:
Open SELL → Stop loss above swing high → Target nearest support.
Bullish Divergence
Occurs when:
Price makes lower lows
MFI makes higher lows
This indicates reduced selling pressure and a potential bullish reversal.
Trade Setup:
Open BUY → Stop loss below swing low → Target recent resistance.
Divergences appear frequently and often signal powerful reversal opportunities, making them a favorite among advanced traders.
Best Practices for Using the MFI Indicator for MT5
To improve accuracy:
Combine MFI with trendlines, channels, support/resistance
Validate signals with candlestick patterns
Use additional indicators like MACD or Moving Averages
Avoid trading solely based on oversold/overbought levels
Always confirm divergence with Market Structure
Conclusion
The Money Flow Index Indicator for MT5 is a reliable technical tool offering multiple trading signals, from momentum shifts to divergence opportunities. While it provides strong reversal indications, traders should always confirm setups with price action and one or two additional indicators. With proper use, the MFI can significantly enhance your MT5 trading strategy.
To download more premium and free MT4/MT5 indicators, visit IndicatorForest.com for powerful trading tools and professional guidance.
FAQ
1 Download
Published:
Nov 18, 2025 21:29 PM
Category: