The RSI Bands Indicator for MetaTrader 5 is a powerful, customizable trading tool that helps traders identify overbought and oversold market zones while providing potential buy and sell entries. Unlike the standard RSI indicator on MT5, which only signals extreme price conditions, the RSI Bands indicator offers enhanced visualization with dynamic bands, making it easier to anticipate reversals and trend continuation points.
The indicator uses colored bands above and below the price chart, which can also act as dynamic support and resistance zones. By combining RSI readings with Price Action, traders gain more confidence in timing entries and exits.
How to Read the RSI Bands Indicator
The traditional RSI indicator signals overbought conditions when the value reaches 70 or higher and oversold conditions at 30 or lower.
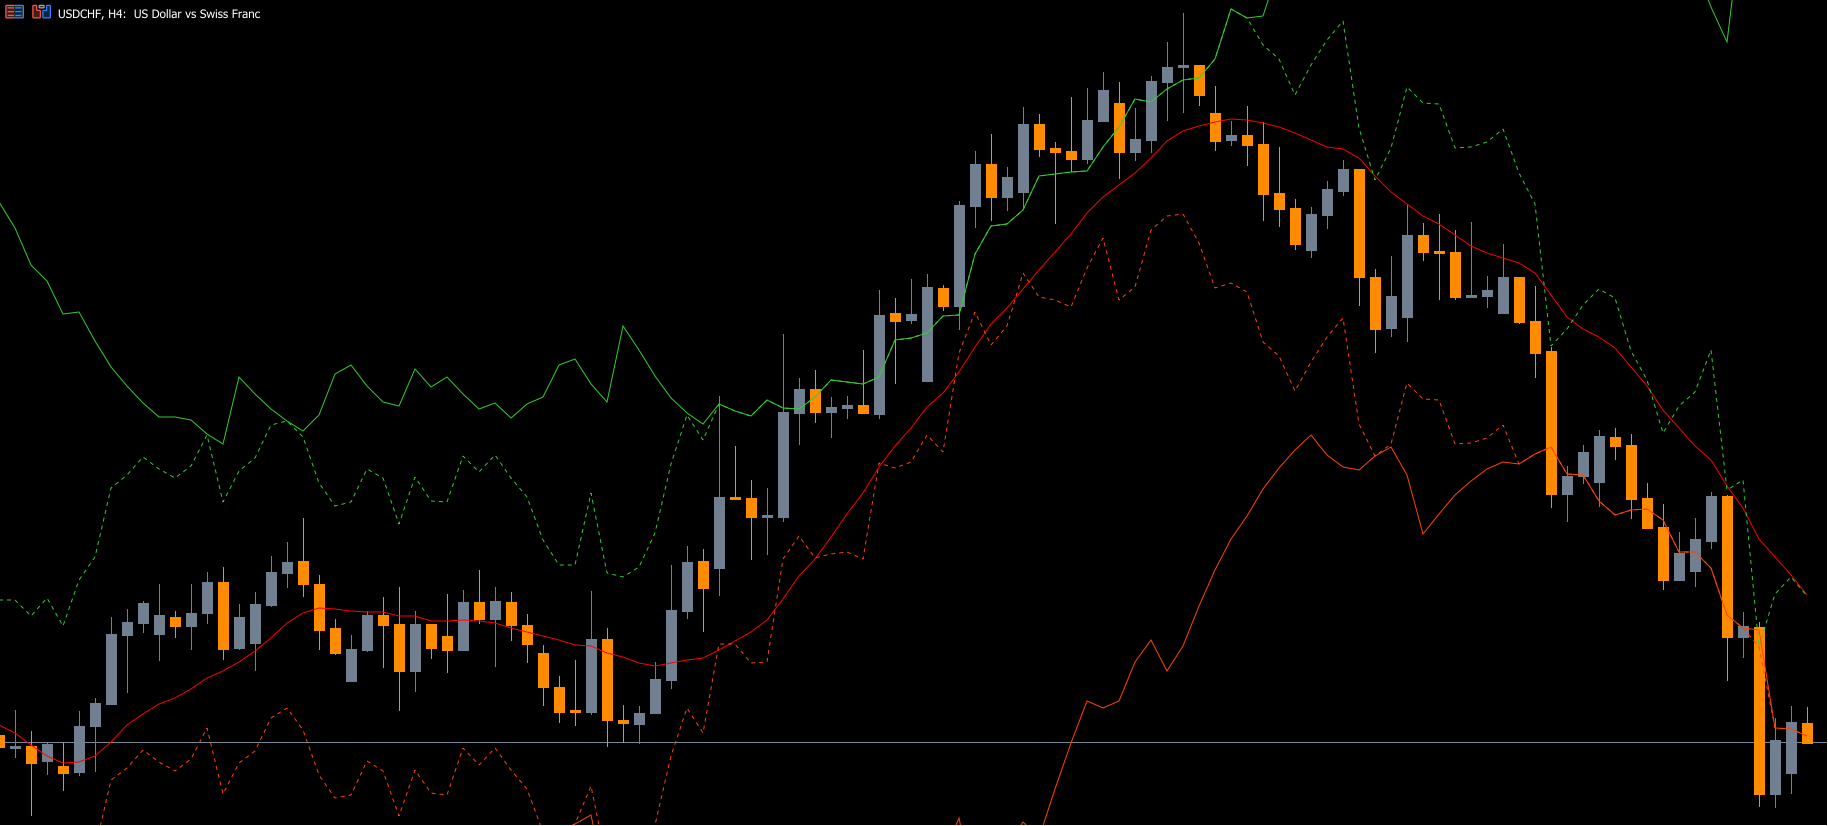
The RSI Bands Indicator extends this functionality by drawing two green lines and two red lines above and below the price chart:
Solid lines track standard RSI levels
Dotted lines represent damped values that fluctuate with price movement
When the price touches or crosses these bands:
Overbought signals appear when the price reaches the upper red bands
Oversold signals appear when the price touches the lower green bands
These bands can also function as dynamic support/resistance levels
Traders are recommended to use the RSI Bands indicator alongside price action, Candlestick Patterns, or other technical indicators to confirm trade setups.
How to Trade Using RSI Bands
Sell Setup
Price crosses above the upper red band, signaling overbought conditions
Price closes back below the band, confirming a potential reversal
Check for supply zones or resistance levels to validate the entry
Enter a sell trade once the bearish candle closes below the supply zone
Buy Setup
Price touches the lower green band, indicating oversold conditions
Price closes above the band, suggesting upward momentum
Confirm with demand zones or support levels
Enter a buy trade after a bullish candle closes above the demand zone
Risk Management
Place stop loss a few pips beyond the band or nearest swing high/low
Take profit based on risk/reward ratio or nearby support/resistance
Avoid trading during sideways or low-volatility conditions
Trading Example
On the EUR/USD M30 chart, the RSI Bands indicator successfully identified an overbought condition:
Price crossed above the red band
A bearish candle closed below the band, confirming a Trend Reversal
Price retested the supply zone, providing a high-probability sell entry
This example demonstrates how combining RSI Bands with price action enhances accuracy in detecting market extremes and trend reversals.
Benefits of the RSI Bands Indicator
Identifies overbought and oversold market conditions with precision
Provides dynamic Support And Resistance levels for entry/exit decisions
Works for scalpers, intraday traders, and swing traders
Enhances standard RSI functionality with visual bands
Compatible with other technical analysis tools to improve trade confirmation
By integrating the RSI Bands indicator into your trading routine, you gain a better visual representation of market extremes, helping reduce false signals and improving trade timing.
Conclusion
The RSI Bands Indicator for MT5 is a dynamic and versatile Forex trading tool that detects extreme market conditions and provides actionable buy/sell signals. It is suitable for Scalping, intraday, and swing trading, making it an essential addition to your MT5 toolkit.
The indicator is free to download and easy to install on MetaTrader 5. For more MT5 trading tools and free indicators, visit IndicatorForest.com.
FAQ
2 Downloads
Published:
Nov 13, 2025 22:03 PM
Category: