The MTF MACD Indicator (Multi-Timeframe MACD) is an enhanced version of the classic Moving Average Convergence Divergence indicator. While traditional MACD shows momentum and divergence on a single timeframe, the MTF MACD allows traders to view MACD values from higher or lower timeframes within one indicator window. This gives both beginner and professional Forex and stock traders a clear understanding of overall market direction and multi-timeframe alignment—an essential component of high-quality trading decisions.
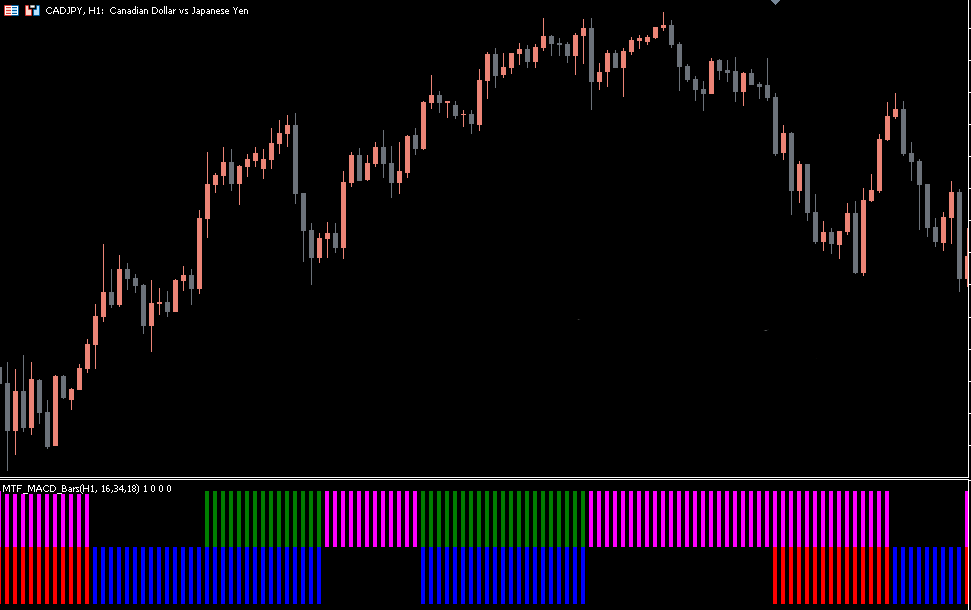
The indicator is widely trusted among Forex traders, stock traders, and commodity traders because it enhances the reliability of trade entries by showing confirmation signals from higher timeframes. For example, the CADJPY H4 MT5 chart often highlights accurate buy and sell setups when using MTF MACD Bars.
How the MTF MACD Indicator Works
The classic MACD is built from:
The 12-period EMA
The 26-period EMA
A signal line (9-period SMA or EMA)
The MTF-version expands this by displaying MACD values from multiple timeframes simultaneously. This shows whether higher timeframe momentum confirms or contradicts the current chart.
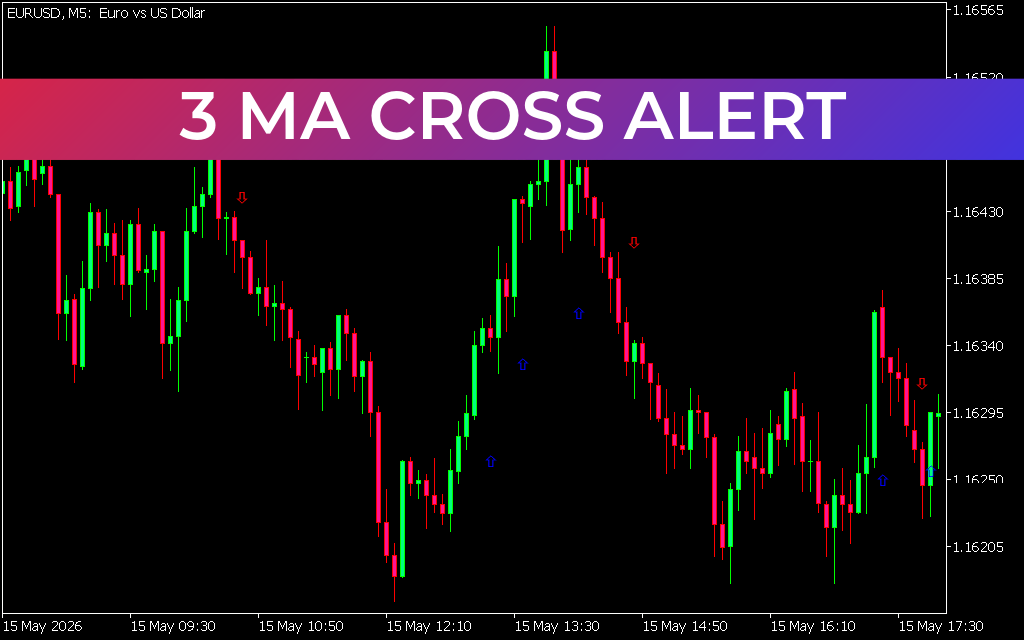
The indicator uses colored bars:
Yellow-green / Green bars → bullish signal
Tomato / Red bars → bearish signal
Seeing these colors across timeframes helps traders determine whether to follow the trend or wait for better alignment.
How to Trade Forex Successfully with the MTF MACD Indicator
Buy Setup
Traders can consider buying when:
The bars in the lower segment turn yellow-green, signaling bullish momentum.
The upper segment bars turn green, confirming extended strength.
Price structure supports continuation (higher highs and higher lows).
This multi-timeframe confirmation increases the probability of entering during a strong trend rather than during weak or uncertain periods.
Sell Setup
A sell opportunity appears when:
The upper segment displays a tomato-colored bar, signaling bearish pressure.
The lower segment bars turn red, confirming strong downward movement.
Price aligns with lower highs and bearish structure.
Exit Strategies
To maximize profits and minimize losses:
Exit long trades if lower or upper bars shift from yellow-green/green to red.
Exit short trades if bars change from red or tomato to yellow-green.
This color-based exit rule helps traders stay disciplined and avoid late exits during reversals.
Using Higher Timeframes with the MTF MACD Indicator
Multi-timeframe trading is one of the most effective ways to identify strong trends. Most trend traders rely on higher timeframes such as H4 or Daily to determine the dominant trend, while lower timeframes like M15 or H1 provide accurate entries.
The MTF MACD makes this process easier by showing:
The current chart’s MACD values (e.g., H1)
Higher timeframe MACD values (e.g., H4)
For example, when analyzing CADJPY on H1, the MTF MACD can simultaneously display the H4 momentum. If the H4 MACD shows bullish momentum and the H1 MACD produces a buy signal, traders can confidently enter in the direction of the main trend.
This dual-timeframe confirmation ensures:
Fewer false signals
Better trade timing
Stronger trend-following opportunities
The indicator is especially valuable for strategies that require higher timeframe confirmation before entering trades on smaller charts.
Why the MTF MACD Indicator Is Superior
Compared to standard MACD, the MTF version offers:
Improved accuracy
Better trend confirmation
Multi-timeframe synchronization
Reduced noise
More reliable divergence signals
Traders who rely on strong trend confirmation will find their results greatly improved when using the MTF MACD Bars.
Conclusion
The MTF MACD Indicator for MetaTrader is ideal for Forex traders who rely on multi-timeframe confirmation to improve accuracy, filter false signals, and align their entries with the dominant trend. Its color-coded bars, synchronized timeframes, and powerful momentum signals make it significantly more effective than traditional MACD.
To enhance your trading performance and access more premium indicators, visit IndicatorForest.com today.
FAQ
2 Downloads
Published:
Nov 15, 2025 01:24 AM
Category: