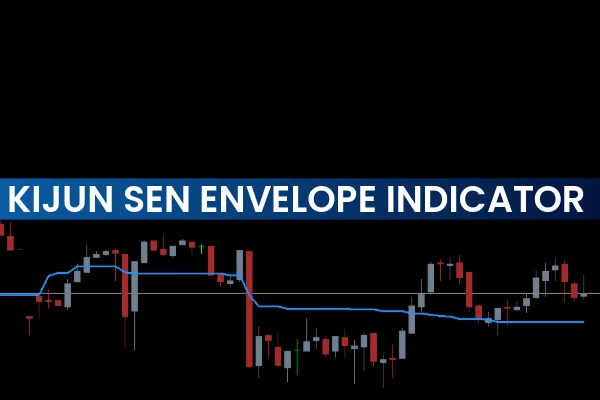
The Kijun Sen Envelope Indicator MT4 is a trend-based technical tool inspired by the Ichimoku Kinko Hyo system. It helps traders identify market direction, Trend Strength, and potential reversal points with its three-line envelope structure. The indicator consists of an upper band, middle band (Kijun Sen), and lower band, forming a cloud-like channel that visually represents market momentum and support/resistance levels.
By plotting these dynamic bands on the chart, the Kijun Sen Envelope Indicator makes it easy for traders to understand when the market is trending upward, downward, or consolidating. Because it filters price fluctuations effectively, it is particularly useful on higher timeframes, where fewer false signals occur.
How the Kijun Sen Envelope Indicator Works
Middle Band – The Trend Detector
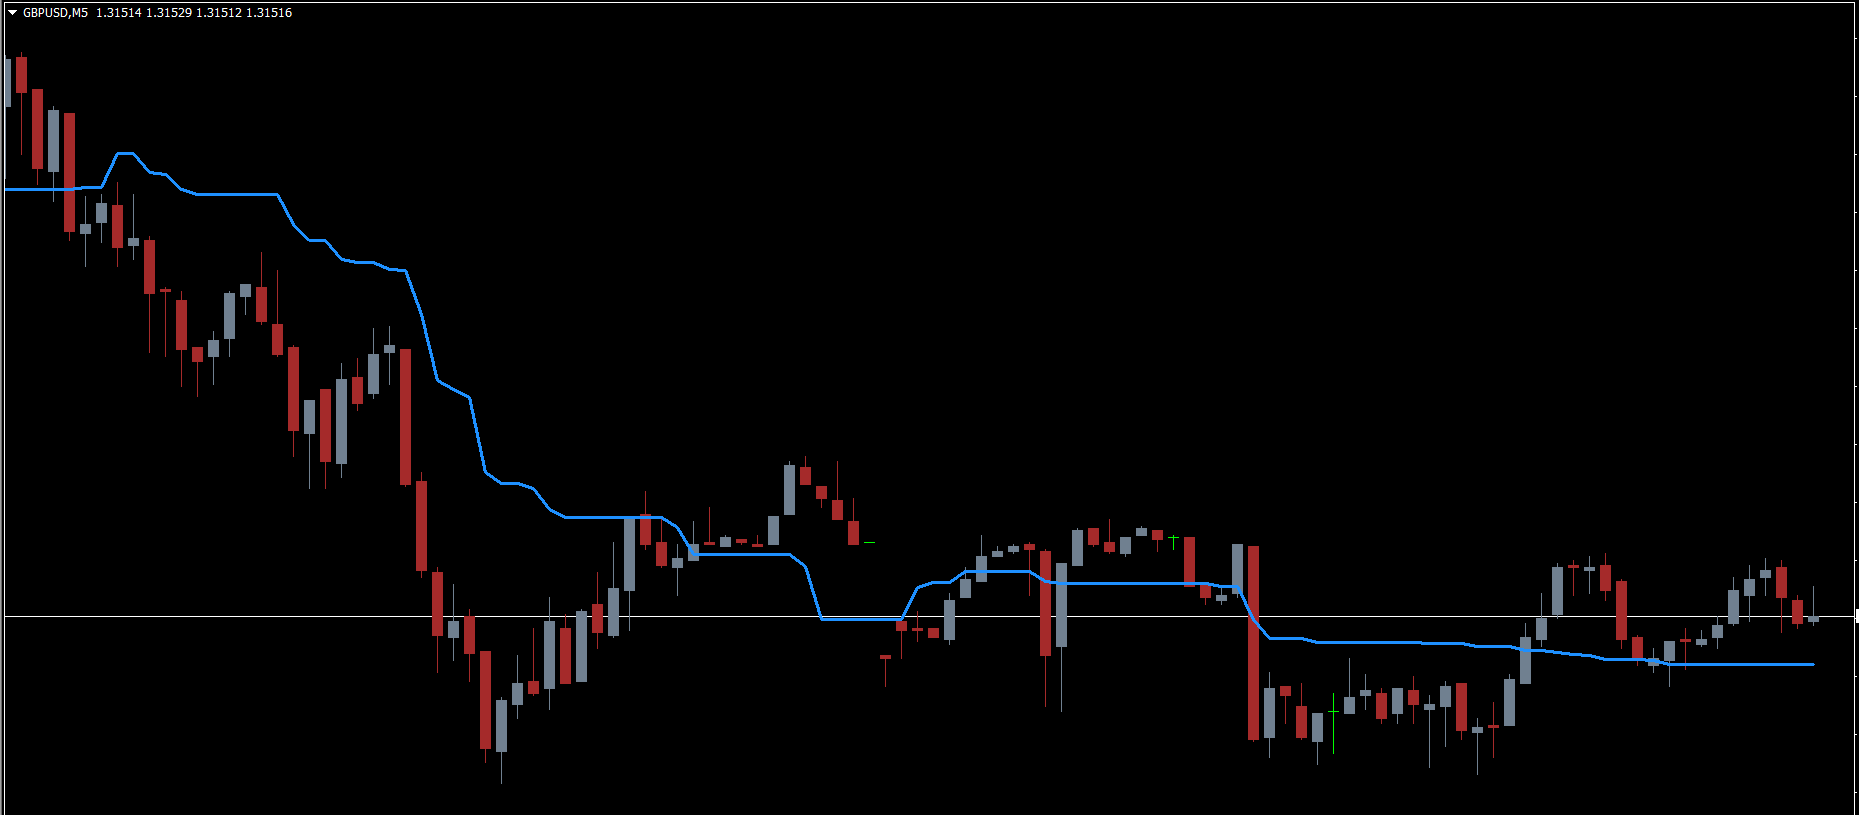
The middle band, known as the Kijun Sen, is the most important line.
When price rises above the middle band, it signals a possible bullish trend.
When price falls below the middle band, it indicates bearish momentum.
This makes the Kijun Sen band a reliable indicator for identifying trend changes.
Upper & Lower Bands – The Envelope
The upper and lower bands act like the Ichimoku Cloud, enveloping the middle band. They help traders visualize:
Dynamic Support And Resistance
Trend strength
Potential breakout or reversal zones
The closer the price moves toward the outer bands, the stronger the trend momentum.
Kijun Sen Envelope Indicator BUY/SELL Signals
Buy Signal
A buy signal forms when:
Price moves below the middle band,
Then shows bullish reaction or attempts to reverse upward.
This represents a potential opportunity to enter long positions, especially when the lower envelope supports the price.
Sell Signal
A sell signal appears when:
Price crosses above the middle band,
Then begins to turn downward.
This indicates a weakening Market Structure and provides ideal conditions for short entries.
Important Note
Traders sometimes confuse the envelopes:
The upper and lower bands are not trend signals but dynamic support/resistance levels.
The middle Kijun Sen is the actual trigger line for trend direction.
Best Timeframes to Use
The Kijun Sen Envelope Indicator works best on:
H4
Daily
Weekly
Higher timeframes minimize market noise and ensure stronger, more reliable signals.
Example Trading Scenario
On a EUR/USD H4 chart:
When the price dips below the Kijun Sen, the indicator shows a buy signal as the market begins to rise again.
Later, when the price breaks above the middle band and starts reversing downward, a sell signal forms.
These examples show how effectively the indicator maps market turning points.
Conclusion
The Kijun Sen Envelope Indicator MT4 brings the power of Ichimoku Cloud into a simplified three-band structure. With the middle band acting as a trend detector and the outer bands providing strong price levels, traders can identify accurate entry and exit points for any strategy.
Whether you trade using trends, reversals, or cloud-based analysis, this indicator is a valuable addition to your toolkit.
👉 Download the Kijun Sen Envelope Indicator and discover more powerful MT4/MT5 tools at IndicatorForest.com.
FAQ
Published:
Nov 17, 2025 21:59 PM
Category: