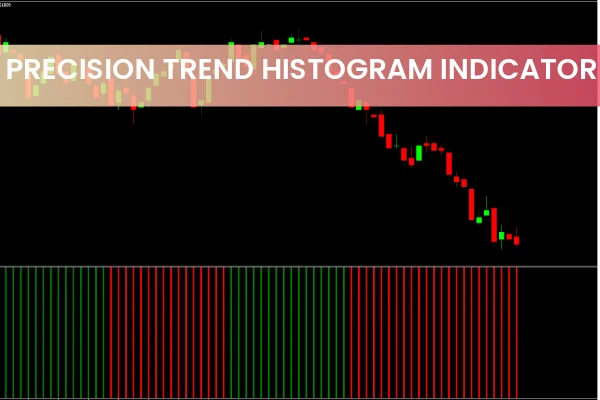
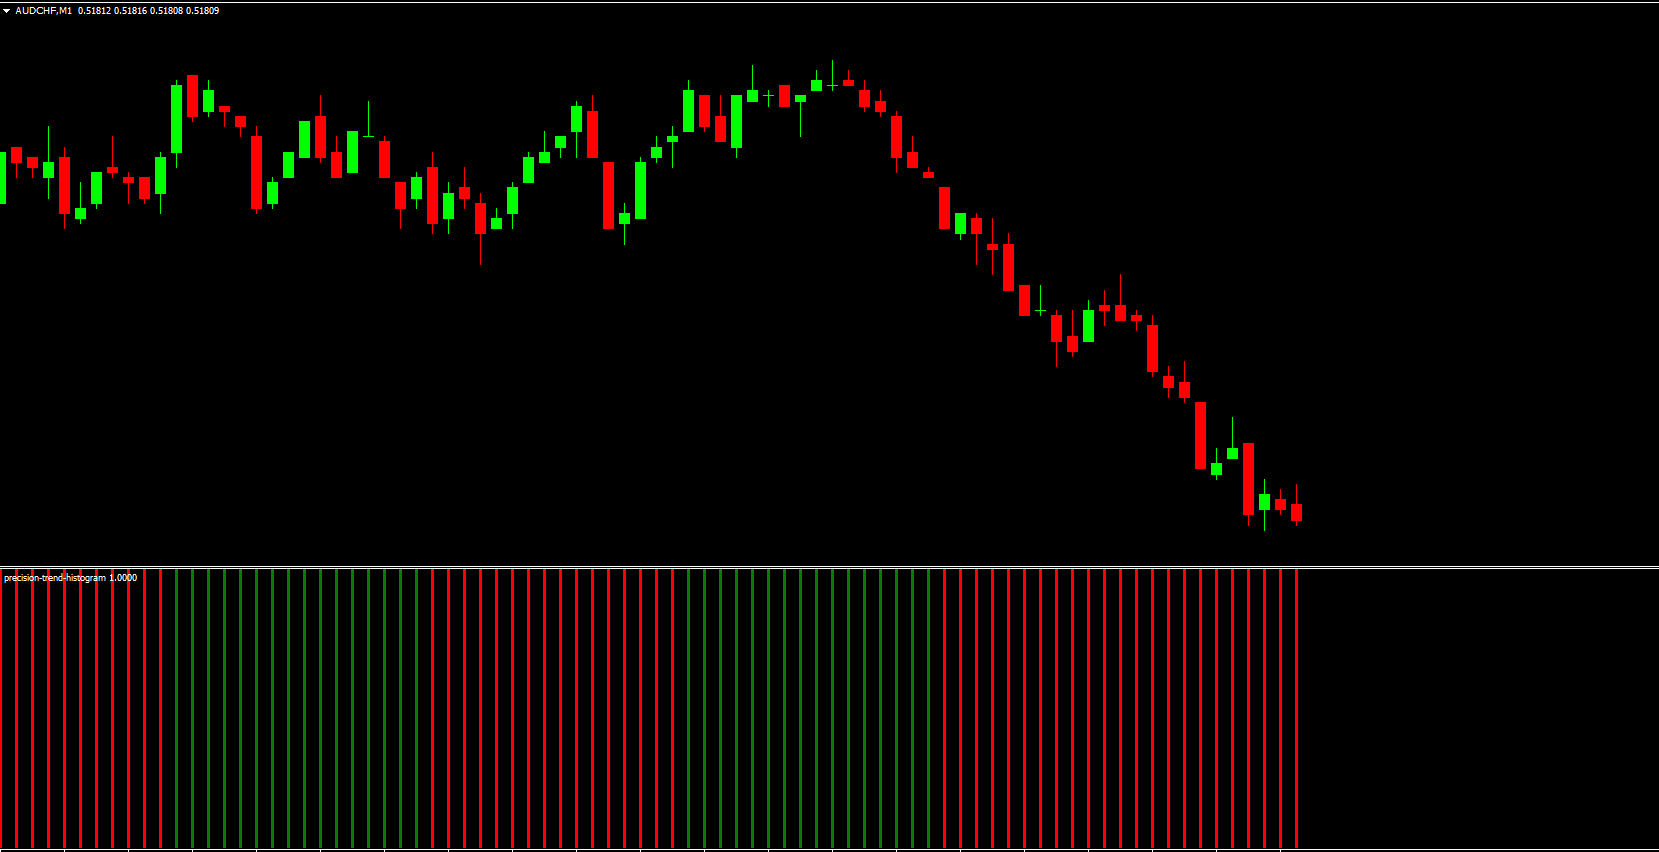
The Precision Trend Histogram is a simple yet effective MT4 indicator designed to help traders instantly identify the direction of the market trend. By plotting a histogram below the main chart, the indicator visually displays bullish and bearish market conditions using green and red bars. This clean, color-based representation makes the Precision Trend Histogram especially useful for both beginner traders and experienced analysts who prefer straightforward trend-reading tools.
What Is the Precision Trend Histogram?
This indicator displays a series of color-coded bars in a separate window:
Green bars signal a bullish (uptrend) market
Red bars signal a bearish (downtrend) market
Because of its simplicity, the Precision Trend Histogram works on any timeframe. However, traders often find it most reliable on higher timeframes such as H1, H4, and Daily charts, where noise is minimized and false signals are less frequent.
Precision Trend Histogram MT4 Buy & Sell Signals
To generate BUY and SELL setups, traders simply monitor the color of the histogram bars.
Bullish (BUY) Signal
When the histogram switches to green bars, it indicates:
Momentum is shifting upward
Buyers are gaining strength
A potential uptrend is developing
At this stage, traders may look for BUY entries, ideally supported by bullish candles or breakouts.
Bearish (SELL) Signal
When the histogram plots red bars, it shows that:
Sellers are dominating the market
Downward momentum is building
A bearish trend is underway
Traders can then target SELL entries while monitoring nearby resistance zones or bearish candle formations for confirmation.
Using the Precision Trend Histogram for Reversal Detection
One of the valuable features of this indicator is its ability to highlight early signs of potential trend reversals.
A color change—from red to green or vice versa—may indicate that the ongoing trend is weakening. Traders can use this signal to:
Close existing positions
Reduce position sizes
Wait for confirmation before opening new trades
However, it’s important to remember that the indicator may not catch every reversal. Because of this, combining it with Price Action,
, or other trend indicators improves accuracy and reduces the risk of premature exits.
Best Practices for Using the Precision Trend Histogram
Apply the indicator on higher timeframes to reduce false signals.
Always combine histogram color changes with candlestick confirmation.
Avoid trading solely on single bar flips—trends need momentum to become reliable.
Consider pairing it with indicators like moving averages, RSI, or trend-lines for added precision.
Conclusion
The Precision Trend Histogram for MT4 is a powerful tool that provides clear insight into market direction using simple red and green histogram bars. Traders can easily identify bullish and bearish phases, manage entries, and plan exits based on color changes. Whether you’re new to forex or an experienced trader seeking clean, no-nonsense trend signals, this indicator is a valuable addition to your MT4 toolkit.
You can download the Precision Trend Histogram for free and explore more trading tools at IndicatorForest.com.
FAQ
2 Downloads
Published:
Nov 20, 2025 23:23 PM
Category: