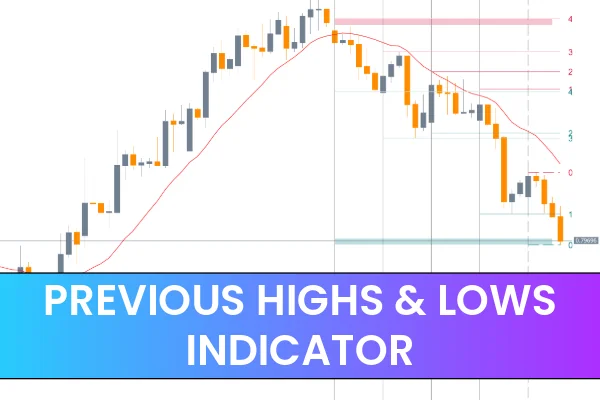
The Previous Highs & Lows Indicator for MetaTrader 5 (MT5), developed by LuxAlgo, is an innovative tool that helps traders automatically identify and plot key historical price levels. These levels—previous highs and lows—serve as crucial support and resistance zones, allowing traders to analyze price behavior with more precision and confidence.
By visually mapping recent price extremes directly onto your MT5 chart, this indicator helps spot potential breakout, pullback, and reversal opportunities at a glance. Whether you’re a scalper, swing trader, or long-term investor, the Previous Highs & Lows Indicator enhances your market analysis by making critical reaction zones instantly visible.
How the Previous Highs & Lows Indicator for MT5 Works
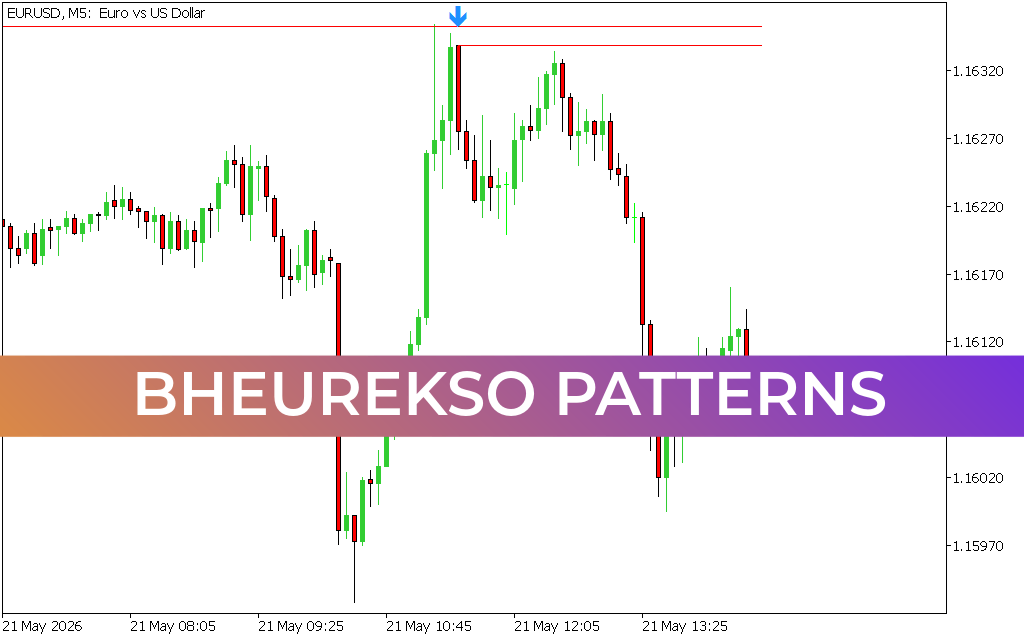
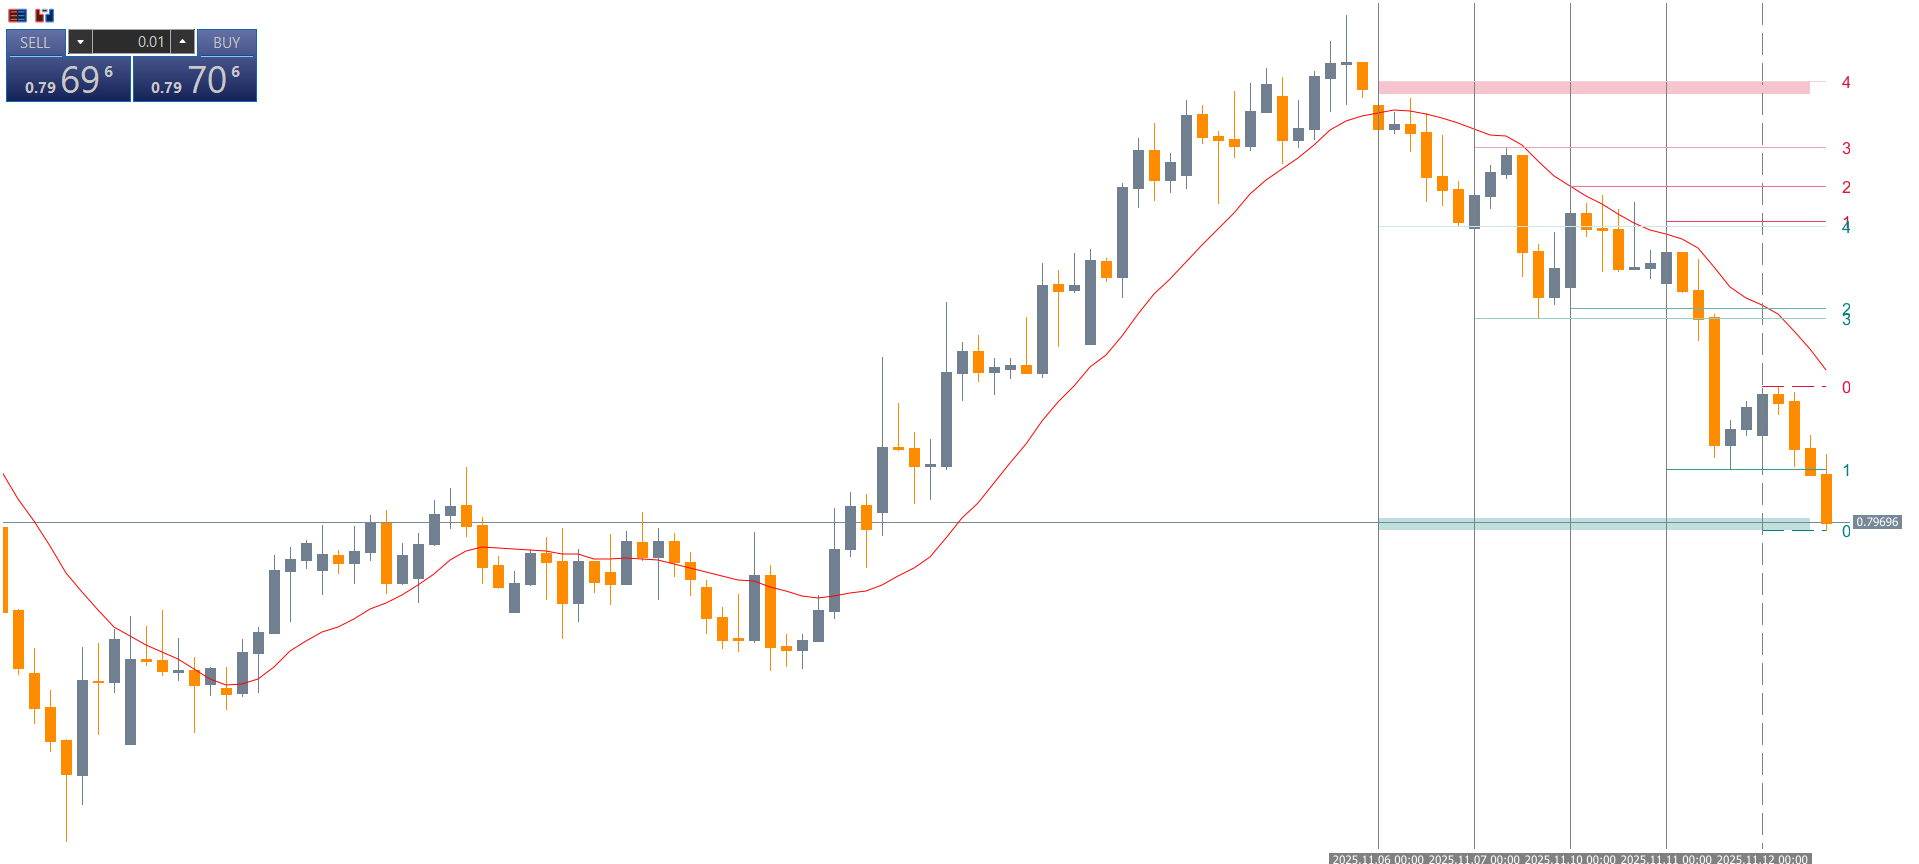
The LuxAlgo Previous Highs & Lows Indicator automatically detects recent price highs and lows from historical data and plots them as horizontal lines or shaded zones on your chart. These plotted levels represent market turning points, showing where the price has previously reversed or stalled.
Unlike traditional manual drawing, this indicator updates dynamically in real-time—no need to constantly redraw lines as the market moves.
Each new candle triggers a recalculation of high and low levels, providing an accurate view of current price structure and momentum.
This automation allows traders to:
Identify Support And Resistance instantly.
Spot potential breakout zones before major moves.
Recognize market consolidation or trend exhaustion areas.
Simplify Price Action analysis by removing chart clutter.
Trading with the Previous Highs & Lows Indicator
1. No Buy/Sell Arrows – Pure Price Action Guidance
Unlike traditional signal indicators, the Previous Highs & Lows MT5 Indicator doesn’t generate entry or exit arrows. Instead, it gives contextual price levels that traders can use for timing and decision-making.
When the price reaches a previous high, it may act as a resistance zone, where the market could either:
Reject the level and reverse (ideal for sell setups), or
Breakout above it and continue the trend (ideal for buy confirmations).
Similarly, when the price revisits a previous low, it may:
Hold as a support level (potential buy area), or
Break below to indicate further downside momentum.
This flexibility makes the indicator suitable for both breakout and mean-reversion strategies.
2. Color-Coded Zones for Clarity
The indicator visually distinguishes bullish and bearish ranges with color-coded lines or shaded zones, depending on your chart settings.
Bullish zones (previous highs) often appear in green or blue.
Bearish zones (previous lows) appear in red or orange.
These visual cues make it easy to recognize trend bias and Market Structure at a glance—perfect for traders who value clean, uncluttered chart setups.
3. Using Previous Highs & Lows for Trade Timing
You can enhance your entry precision and risk management using this indicator:
Buy Setup Example: When price breaks and closes above a previous high, confirm the breakout with volume or momentum indicators (like RSI or MACD), then enter a long trade.
Sell Setup Example: When price drops below a previous low, confirm the breakdown, then enter a short position.
Stop-Loss Placement: Place stops just below (for buys) or above (for sells) the plotted level to reduce false breakouts.
Take-Profit: Use the next plotted high/low as your target or monitor price action around these zones.
By combining previous highs and lows with trend indicators or oscillators, traders can filter out weak signals and focus on high-probability setups.
Advantages of the Previous Highs & Lows Indicator for MT5
✅ Automatic Plotting: Eliminates manual effort of drawing lines for past highs and lows.
✅ Clean Visualization: Keeps charts simple and readable, highlighting only essential zones.
✅ Versatile Use: Works with all trading styles—Scalping, intraday, or swing trading.
✅ Real-Time Updates: Adapts instantly to new price movements.
✅ Perfect for Confluence Trading: Combine with moving averages, volume, or Candlestick Patterns for stronger confirmations.
Best Settings for the LuxAlgo Previous Highs & Lows Indicator
While default settings work well, you can fine-tune the indicator for your strategy:
Period: Defines how many past candles to consider for calculating highs/lows.
Zone Width: Adjusts the shading thickness to highlight more or less area around each level.
Alert Options: Enable notifications for when price interacts with previous highs/lows.
Recommended configurations:
Parameter
Suggested Value
Timeframes
M15, H1, H4
Markets
Forex, Indices, Commodities, Crypto
Style
Clean lines or shaded zones (based on preference)
Who Should Use the Previous Highs & Lows Indicator?
This indicator is perfect for:
Price action traders who rely on chart structure.
Breakout traders targeting volatility-driven moves.
Swing traders identifying reversal points.
Technical analysts who prefer data-driven support/resistance plotting.
Because it’s lightweight and visually intuitive, even beginner traders can quickly interpret its signals without overcomplicating their analysis.
Conclusion
The Previous Highs & Lows Indicator for MT5 by LuxAlgo is a must-have tool for traders who rely on technical price levels to make informed trading decisions. It automatically identifies key historical highs and lows, helping traders anticipate breakouts, reversals, and consolidation zones with confidence.
By combining clean visuals with real-time analysis, this indicator enhances your trading precision without cluttering your charts. Whether you trade forex, gold, indices, or crypto, the LuxAlgo Previous Highs & Lows Indicator will give you a strategic edge in understanding market behavior and improving your trade timing.
👉 Download the Previous Highs & Lows Indicator for MT5 Free from IndicatorForest.com and upgrade your technical trading toolkit today.
FAQ
25 Downloads
Published:
Nov 12, 2025 12:16 PM
Category: