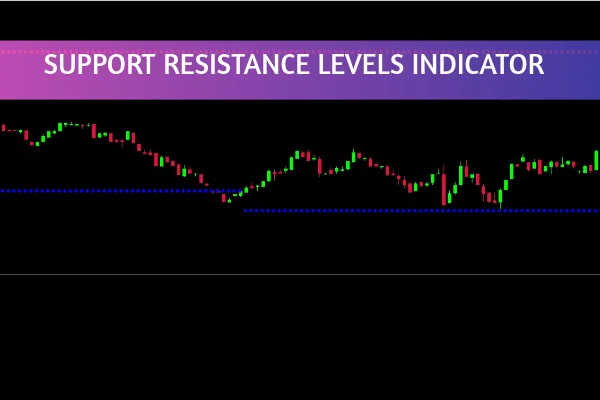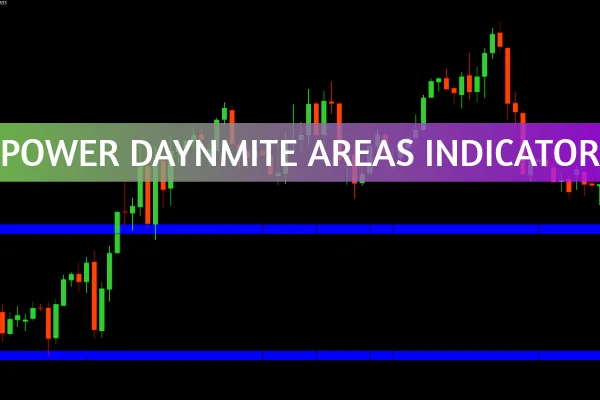
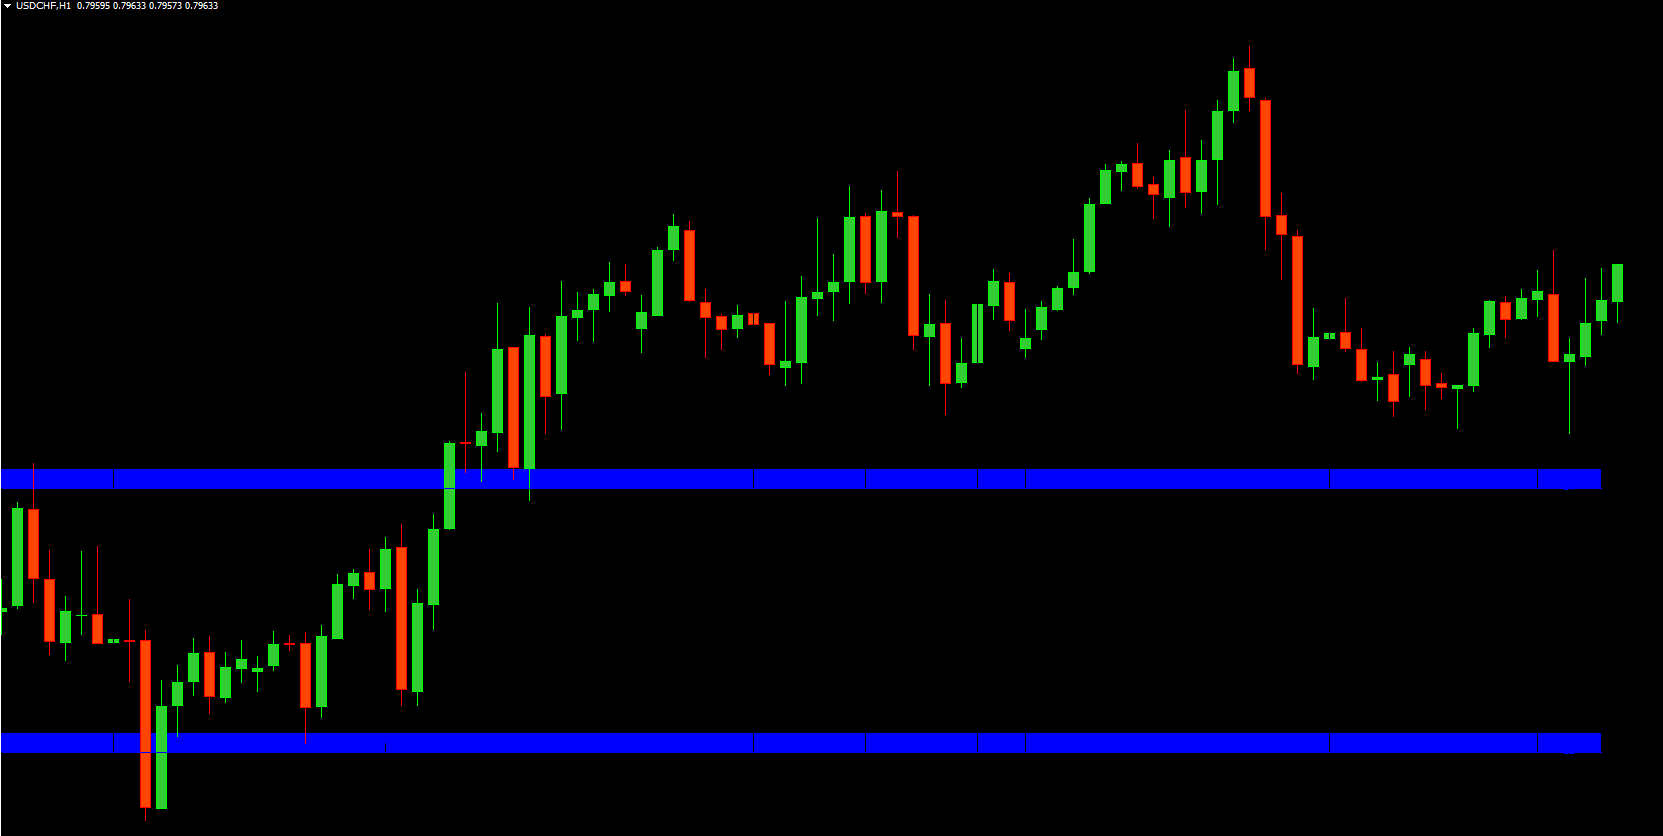
The Power Dynamite Areas Indicator for MT4 is a cutting-edge trading tool that identifies crucial support and resistance zones on your charts. By analyzing historical price movements, it highlights areas where the price has previously reacted — giving traders an edge in predicting future market behavior. Whether you trade forex, commodities, or stocks, this indicator helps you recognize potential reversals and breakouts with accuracy.
Using the Power Dynamite Areas Indicator, traders can better visualize key levels that often act as psychological barriers, influencing how the market behaves. This makes it an invaluable resource for price action traders seeking to refine their entries and exits.
The Power Dynamite Areas Indicator functions by examining past price data to detect levels of high trading activity. These zones often coincide with points where the price has reversed or stalled before.
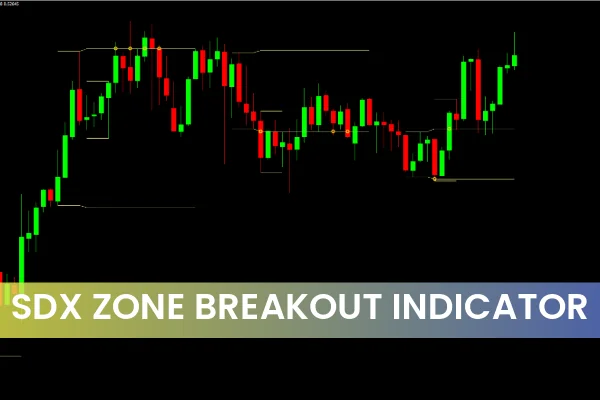
When the current price approaches one of these dynamite zones, traders can anticipate one of two outcomes:
Reversal: The price bounces back after hitting a strong resistance or support zone.
Breakout: The price moves strongly beyond the zone, often starting a new trend.
The indicator’s algorithm adjusts dynamically, ensuring that the displayed areas remain relevant even as market conditions evolve. This helps traders avoid outdated signals and focus on zones that truly matter.
There are many benefits to integrating this tool into your MT4 trading setup:
Visual Clarity: Clear, color-coded areas make it easy to spot potential trading opportunities.
Enhanced Decision-Making: Identify high-probability entry and exit points with greater confidence.
Customizable Settings: Adapt the indicator to suit your preferred timeframes and trading style.
Versatility: Works seamlessly across forex pairs, indices, metals, and cryptocurrencies.
This indicator complements both manual trading and automated strategies, helping traders fine-tune their performance regardless of experience level.
When the indicator highlights a support or resistance zone, it signals that price action is likely to react. Traders can look for confirmation patterns such as candlestick reversals, breakouts, or volume spikes to validate their decisions.
For instance:
If the price approaches a strong resistance zone and shows rejection patterns, it could be a signal to enter a short position.
Conversely, if the price breaks through a key support zone with strong momentum, it may indicate a continuation of the trend.
By combining these signals with sound risk management, traders can greatly enhance their profitability.
Combine with other tools: Use it alongside indicators like Moving Averages or RSI for confirmation.
Avoid overtrading: Wait for clear reactions around the identified zones before entering.
Adjust sensitivity: Fine-tune the settings for different market conditions — tighter zones for scalping, wider zones for swing trading.
These simple adjustments can significantly improve your trading performance and confidence.
The Power Dynamite Areas Indicator for MT4 is an essential addition for traders who rely on support and resistance analysis. By pinpointing precise price zones based on historical data, it empowers you to make smarter trading decisions and manage your risk more effectively.
Ready to trade with precision?
👉 Download the Power Dynamite Areas Indicator today at IndicatorForest.com and elevate your trading strategy to the next level.
Published:
Oct 24, 2025 07:37 AM
Category: