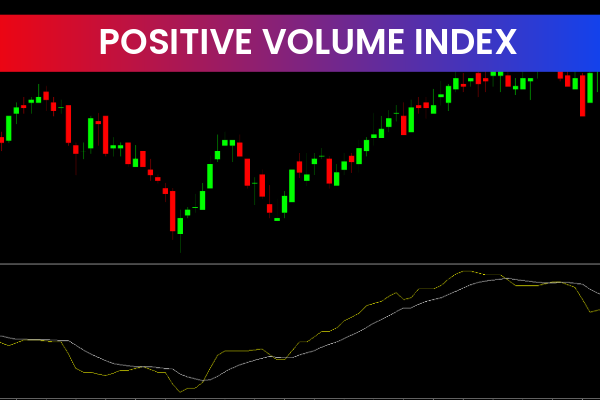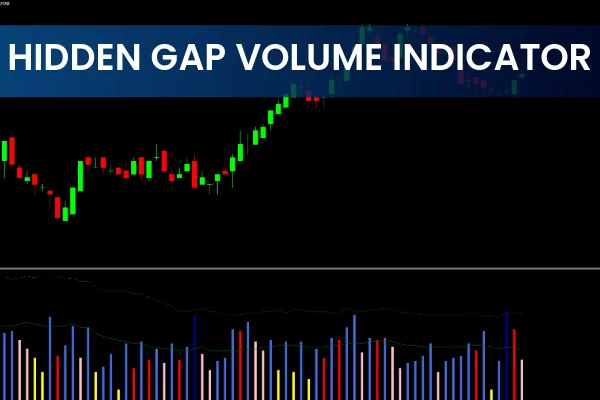
The Hidden Gap Volume Indicator is a powerful MT4 tool designed to distinguish positive and negative trading volumes in live forex and stock markets. Volume is one of the most critical components of market analysis, as it reveals the strength behind price movement. Using the Hidden Gap Volume Indicator, traders can recognize valid momentum shifts, confirm breakouts, and identify high-probability buy and sell signals.
In online trading, volume analysis is essential for spotting changes in Supply And Demand. This indicator simplifies that process by visualizing momentum strength using color-coded volume bars and moving average signals. Whether you're a beginner or an experienced trader, the Hidden Gap Volume Indicator helps you interpret price action with greater accuracy and confidence.
Key Features of the Hidden Gap Volume Indicator
Color-Coded Volume Bars
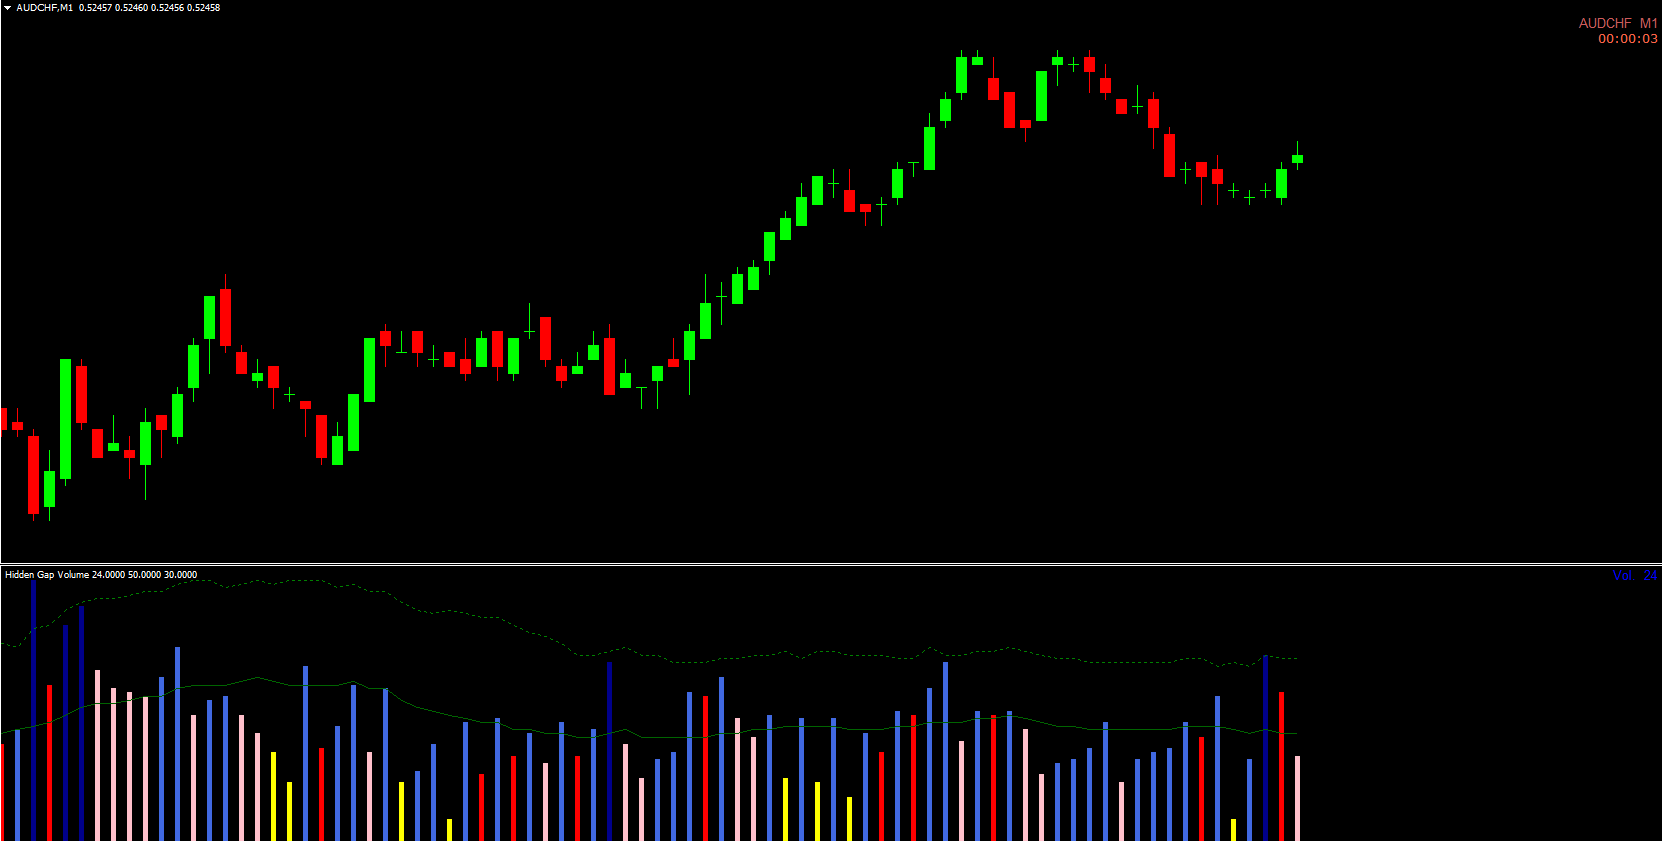
The indicator displays four types of volume bars, each representing a specific market condition:
Blue Volume Bars
A blue bar forms when the current trading volume exceeds the previous candle’s volume. This signals increased activity and potential continuation of the current price move. For example, if price breaks resistance on a high blue volume bar, the breakout is likely valid.
Red Volume Bars
A red bar indicates volume has dropped compared to the previous candle. This suggests weakening momentum, reduced trading participation, or potential consolidation. Red bars often signal caution and may warn traders to avoid entering during indecisive market conditions.
Gray Volume Bars
A gray bar forms when current volume exceeds the last 20 intervals. This suggests sustained interest and supports the ongoing price trend. Gray bars are often used to validate ongoing market direction.
Lighter Red Bars
These red bars indicate volume is lower than the last 20 periods, signaling consolidation or weak momentum. When these appear frequently, the market may be preparing for a breakout or continuing sideways.
Moving Average and Standard Deviation Signals
The Hidden Gap Volume Indicator also includes:
A 20-period moving average line plotted in dark green
A dotted upper curve representing a 30-period standard deviation
When volume bars rise above the moving average line, the market shows strong momentum. This helps traders validate breakout movements, Trend Continuation patterns, and reversals.
Example:
If the price chart forms a bullish breakout and the indicator prints a high blue volume bar above the MA line, traders can treat it as a strong bullish continuation signal.
How to Trade Like a Pro With the Hidden Gap Volume Indicator
Confirm Breakouts
A breakout is only reliable when supported by strong volume.
If a bullish breakout occurs with a blue bar above the MA line: valid buy signal
If price breaks support with a strong volume spike: valid sell signal
Validate Reversals
Before executing sell trades on bearish reversal patterns, check the volume bars:
Positive volume = stronger continuation
Weak or red volume = unreliable reversal
Avoid Low-Volume Conditions
Frequent red bars or low-volume activity indicate consolidation.
This is often a no-trade zone, as Price Action becomes unpredictable.
Why Traders Prefer the Hidden Gap Volume Indicator
The Hidden Gap Volume Indicator offers a simple yet effective approach to volume interpretation. By combining real-time supply and demand data, color-coded signals, and MA-based confirmation, traders can filter weak setups, enhance timing, and confidently plan entries and exits.
To explore more premium MT4 and MT5 tools, advanced indicators, and algo-trading resources, visit IndicatorForest.com.
FAQ
11 Downloads
Published:
Nov 26, 2025 23:18 PM
Category: