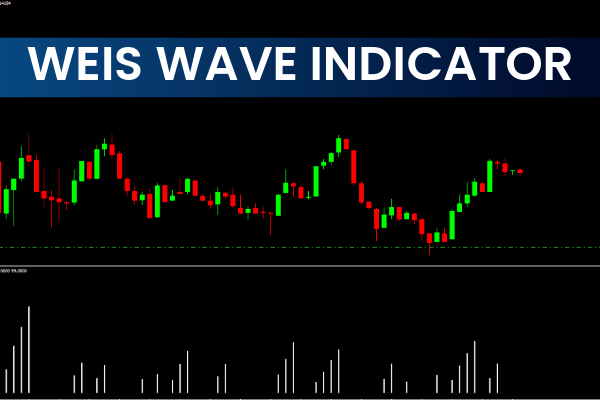
The WeisWave Indicator is a sophisticated yet visually simple technical tool for Metatrader 4. Designed to analyze market waves, it helps traders understand the dynamics of supply and demand by calculating cumulative volume for bullish and bearish waves.
Developed by David Weis, the indicator is based on Richard Wyckoff’s method, which examines price and volume relationships to forecast market behavior. Although it may appear simple at first glance, the WeisWave Indicator provides deep insight into market processes and is suitable for both intraday traders and long-term investors.
How the WeisWave Indicator Works
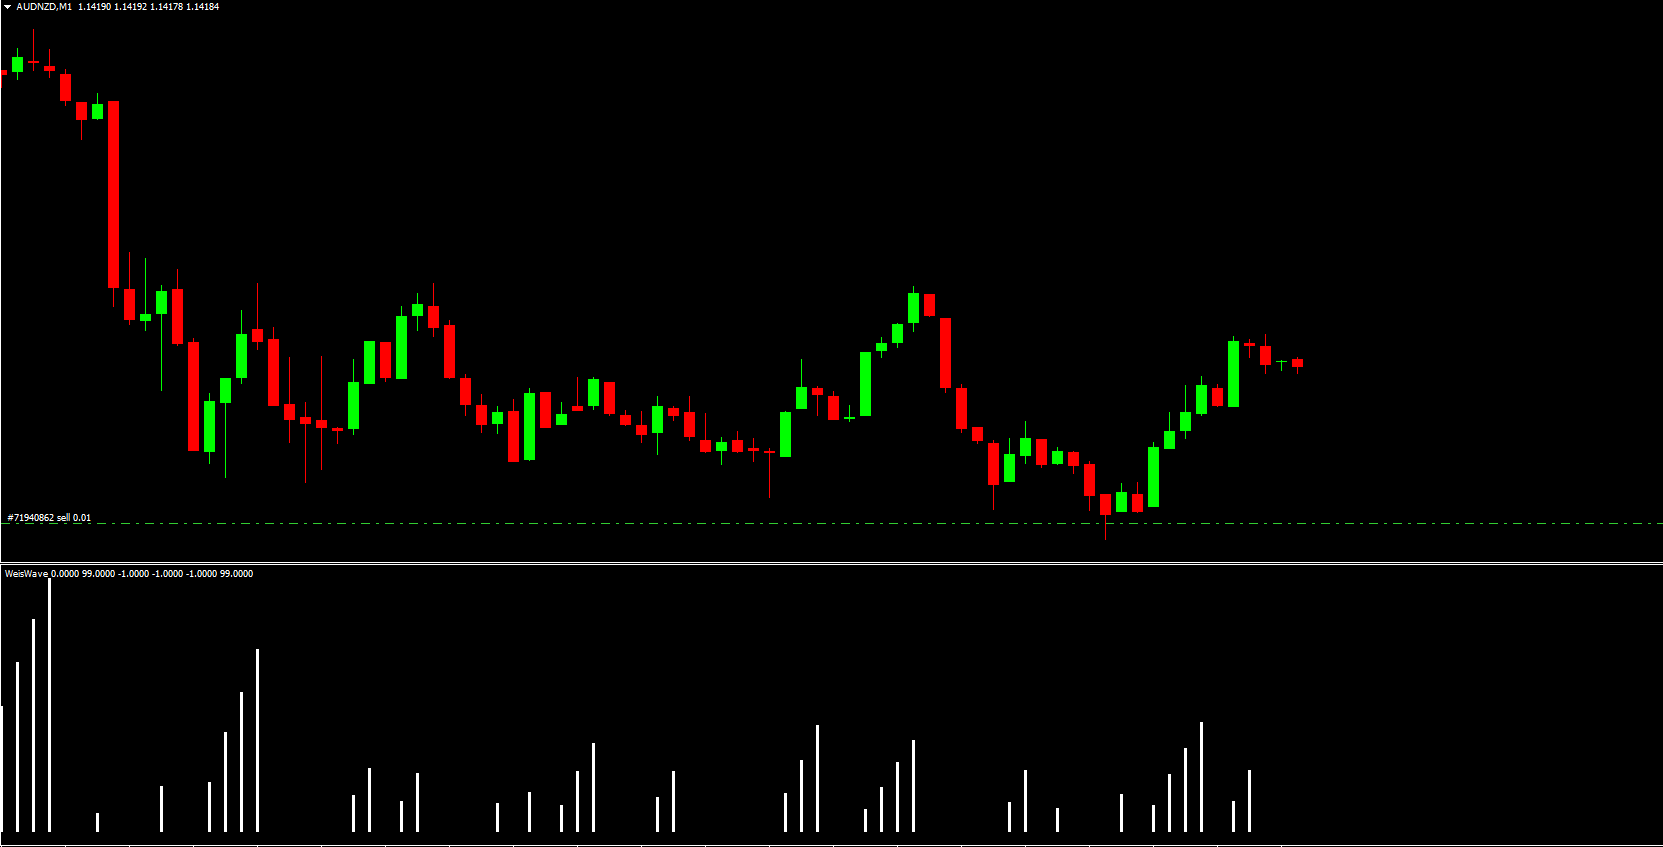
When added to your MT4 chart, the WeisWave Indicator displays a two-color histogram below the main price chart. Each wave in the price chart—bullish or bearish—is analyzed, and cumulative volume is calculated for that wave.
Bullish waves reflect buyer strength (demand).
Bearish waves reflect seller strength (supply).
By comparing the effort (volume) and progress (price movement), traders can identify strong and weak waves, anticipate potential reversals, and make informed trading decisions.
Technical Concept Behind the WeisWave Indicator
Wave Analysis – Price data is divided into bullish and bearish waves.
Cumulative Volume Calculation – The total volume of each wave is summarized on the histogram.
Supply And Demand Measurement – The indicator helps determine whether buyers or sellers dominate the market.
Unlike traditional volume indicators, the WeisWave Indicator makes it easier to spot significant market moves and hidden trends by showing cumulative volume per wave.
How to Trade Using the WeisWave Indicator
Intraday Trading Example
Observe a strong bullish wave with high cumulative volume.
Wait for the subsequent bearish wave to test seller strength.
When a new bullish wave begins, consider entering a long position.
Place a stop-loss below the previous local low and use trailing stops to lock in profits.
Trading Reversals
Monitor changes in cumulative volume to detect weakening buyer momentum or strengthening sellers.
Switch to a lower timeframe or use additional indicators for optimal entry points.
Protect trades with stop-loss orders and trailing stops.
Key Tips
Always ensure a favorable risk-to-reward ratio.
Combine WeisWave with other tools like RSI, trendlines, or moving averages for confirmation.
Advantages of the WeisWave Indicator
Supply and demand analysis – Understand market dynamics at a granular level.
Works across all markets – Forex, stocks, and commodities.
Suitable for all timeframes – From intraday Scalping to long-term investing.
No repainting – Provides consistent, reliable signals.
Combinable with other indicators – Enhances existing trading strategies.
Limitations
Does not provide automatic buy or sell signals.
Requires training and practice to interpret correctly.
Recommended to read David Weis’ book “A Modern Adaptation of the Wyckoff Method” for deeper understanding.
Conclusion
The WeisWave Indicator MT4 is a powerful tool for traders who want to analyze price waves and cumulative volume. By understanding market supply and demand, traders can make more informed decisions, spot reversals, and trade in harmony with market makers.
Before using it on live accounts, it’s advisable to practice on a demo account and combine it with other technical analysis tools.
Download the WeisWave Indicator for MT4 for free today and enhance your trading strategy with advanced wave and volume analysis.
FAQ
Published:
Nov 25, 2025 22:27 PM
Category: