The KG Support And Resistance Indicator for MT4 is one of the most powerful tools for identifying important price levels in the forex market. Support and resistance zones act as decision points where price tends to pause, bounce, or break out. This indicator automatically detects these levels based on historical market behavior, making it highly valuable for both beginner and professional traders. By removing the guesswork from manual plotting, the KG Support And Resistance Indicator provides objective, accurate, and multi-timeframe analysis.
How the KG Support and Resistance Indicator for MT4 Works
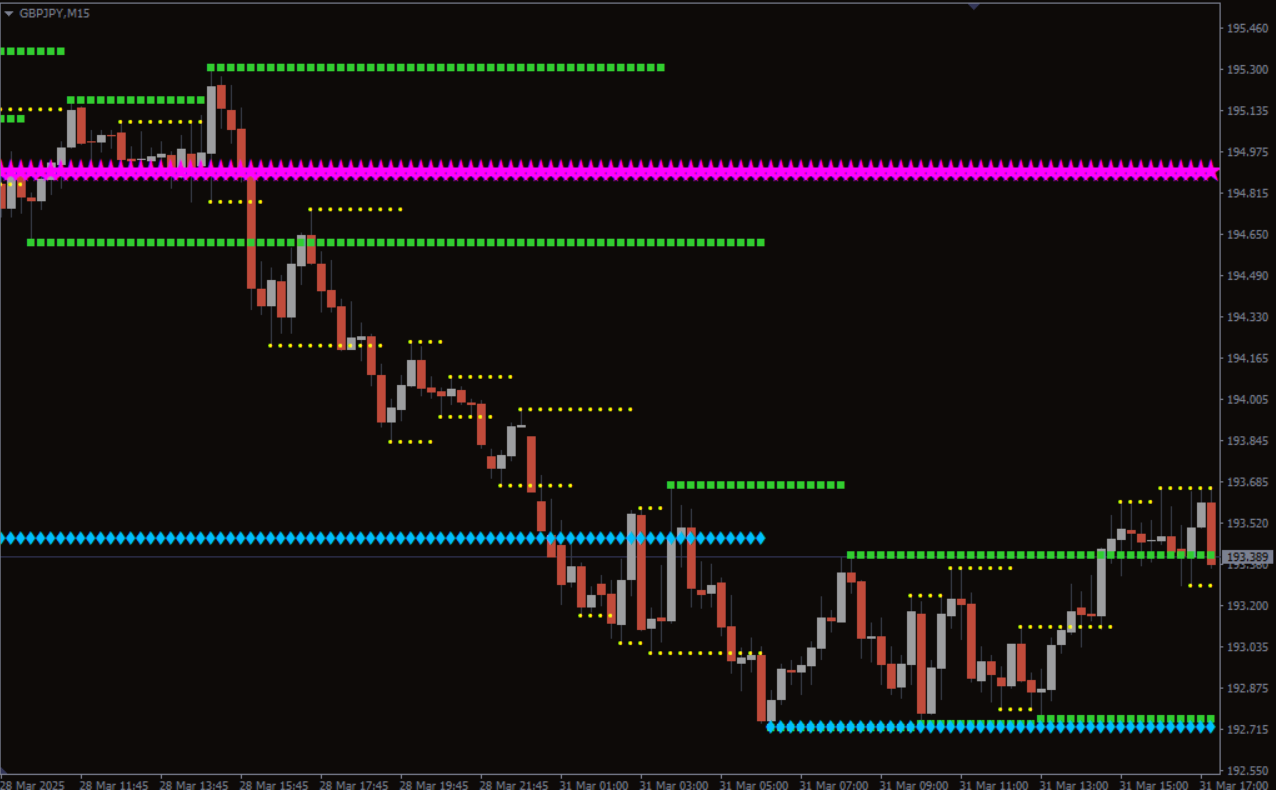
The KG Support and Resistance Indicator automatically scans Market Structure and plots support and resistance zones across multiple timeframes. Instead of manually drawing lines that may be subjective, the indicator looks at previous highs, lows, and turning points to generate reliable zones.
A unique feature of the indicator is its color-coded levels. Each color represents a different timeframe, making chart reading simple and intuitive. For example:
Yellow – 15-minute support and resistance
Green – 1-hour levels
Blue – 4-hour levels
Magenta – Daily levels
This visual clarity helps traders instantly recognize which price levels carry more weight. Higher-timeframe levels are generally more reliable, and when multiple colors overlap, the zone becomes a high-probability area of interest.
Benefits of Multi-Timeframe Support and Resistance Zones
Multi-timeframe analysis is essential for accurate trading. The KG Support and Resistance Indicator for MT4 provides a layered market structure that helps traders:
Identify key reversal points
Avoid false breakouts
Understand broader market direction
Determine strong demand and supply areas
Align trades with high-probability market zones
When a 1-hour level aligns with a 4-hour or daily zone, it signals a strong reaction area where institutions are often active. These “stacked zones” are ideal for swing trading, intraday trading, and breakout strategies.
Trading With the KG Support and Resistance Indicator
Using Support Zones for Long Trades
Traders can look for buying opportunities when price approaches a strong support zone. If price tests the level multiple times without breaking it, the zone becomes more reliable. Candle patterns (e.g., pin bars, engulfing candles) or confirmation signals from indicators like RSI or MACD can improve accuracy.
Using Resistance Zones for Short Trades
A resistance zone that repeatedly rejects price often signals potential short setups. When price reacts negatively at these zones, traders can enter short positions with well-placed stop-losses above the resistance level.
Identifying Breakouts and Retests
The KG Support and Resistance Indicator for MT4 is also helpful in identifying breakout setups. When price breaks above resistance or below support, traders can watch for a retest before entering a continuation trade.
Confluence Trading for Higher Accuracy
Combining the indicator with trendlines, moving averages, or candlestick patterns helps traders avoid false signals. Overlapping support or resistance zones from different timeframes indicate strong institutional activity, creating high-probability trading opportunities.
Why Traders Prefer the KG Support and Resistance Indicator
Fully automatic zone detection
Highly visual and easy to understand
Ideal for Scalping, day trading, and swing trading
Works on all MT4 currency pairs and timeframes
Reduces market noise and highlights precise decision areas
Whether you are new to forex trading or an experienced trader, this indicator helps you stay ahead of market reversals, consolidations, and breakout levels.
Conclusion
The KG Support and Resistance Indicator for MT4 is an essential tool for traders seeking objective, multi-timeframe insight into market structure. The automated plotting of support and resistance levels saves time, enhances accuracy, and simplifies trade planning. Its color-coded zones make chart reading easier, while overlapping levels highlight the strongest reversal points.
To download this powerful MT4 indicator and access more free forex tools, visit IndicatorForest.com today.
FAQ
3 Downloads
Published:
Nov 26, 2025 22:58 PM
Category: