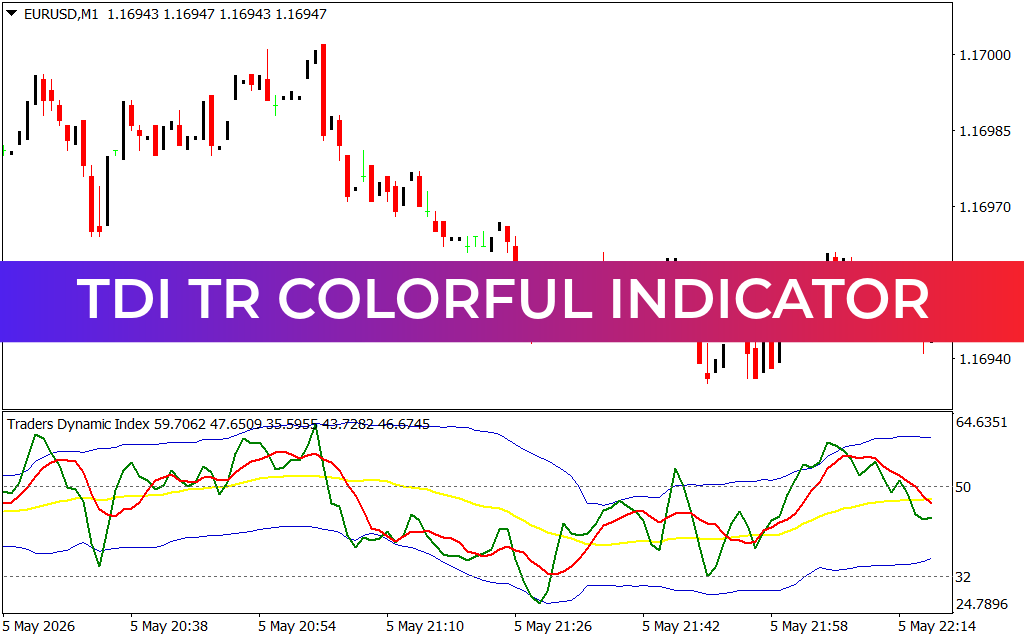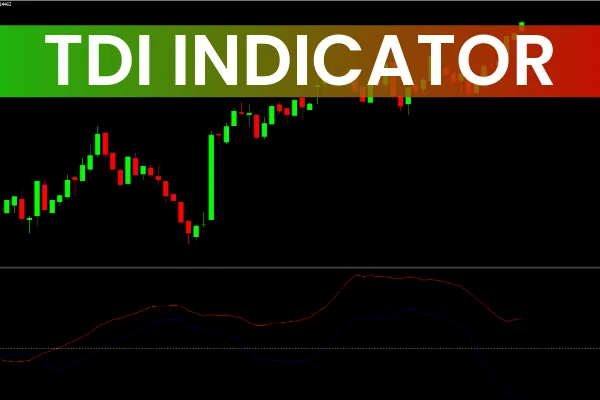
The Traders’ Dynamic Index (TDI) is a popular and versatile trading indicator designed by Dean Malone. It combines three powerful tools — the Relative Strength Index (RSI), Moving Averages, and Bollinger Bands — to create a single, integrated market analysis system.

Because the TDI blends volatility, market sentiment, and Trend Strength, it helps traders quickly identify high-probability buy and sell opportunities. The TDI Indicator for MT4 (free download) appears in a separate sub-window and is widely used in swing trading, day trading, and algorithmic strategies.
How the TDI Indicator Works
The TDI consists of multiple dynamic components, each serving a specific purpose:
RSI Price Lines (Green/Blue and Red)
Blue/Green Line: The fast RSI line, showing short-term momentum.
Red Line: The signal line, derived from a longer-period moving average of the RSI.
These lines help traders identify shifts in market strength and detect Trend Continuation or reversal points.
Bollinger Bands (Volatility Bands)
The TDI also includes three Bollinger Band–style lines:
Two outer blue bands marking the 68 (overbought) and 32 (oversold) zones.
A yellow middle band, representing the market baseline.
The indicator becomes a complete sentiment and volatility system by combining RSI movements with volatility bands.
How to Read the TDI Indicator
Overbought and Oversold Areas
Above 68 → Overbought (possible bearish reversal)
Below 32 → Oversold (possible bullish reversal)
These levels help identify exhaustion in the current trend.
Market Sentiment (Yellow Line)
The yellow line acts as a market baseline, providing directional bias:
Above 50 → Bullish sentiment
Below 50 → Bearish sentiment
When the yellow line crosses key levels (32, 50, 68), it signals potential trend momentum or reversals.
TDI Buy and Sell Trading Signals
The TDI is known for producing clean and powerful entry signals, especially when combined with the yellow baseline.
BUY Signal
A buy signal occurs when:
The blue/green RSI line crosses above the red signal line from below.
Confirmation strengthens if the red line also crosses above the yellow line, signaling rising bullish strength.
SELL Signal
A sell signal occurs when:
The blue/green RSI line crosses below the red signal line from above.
Confirmation strengthens when the red line crosses below the yellow line, indicating bearish dominance.
Additional Signal: Baseline Cross
When the yellow baseline crosses:
Above 50 → buy bias
Below 50 → sell bias
Above 68 or below 32 → possible reversal or pullback
These baseline levels help traders filter weaker signals.
Exit Strategy
A simple but effective exit method is built into the TDI system:
For BUY Trades
Exit at the next resistance level, or
When the blue line crosses the red line downward.
For SELL Trades
Exit at the next support level, or
When the blue line crosses the red line upward.
This aligns exits with momentum shifts, improving trade consistency.
Chart Example
In GBP/JPY (5-minute chart):
A bearish move occurred when the green/blue RSI line crossed below the red line.
Price rallied when the blue line later crossed the red line from below, forming a clear bullish signal.
Why Trade With the TDI?
The Traders’ Dynamic Index integrates multiple indicators into one system:
RSI → momentum
Moving Averages → trend smoothing
Bollinger Bands → volatility and Market Structure
Because of this, the TDI can function as a stand-alone strategy, though traders often achieve higher accuracy by combining it with:
Trend indicators (e.g., SuperTrend, Trend Magic)
Conclusion
The Traders’ Dynamic Index Indicator for MT4 is one of the most effective all-in-one trading tools for identifying buy/sell opportunities. Its unique combination of RSI, moving averages, and volatility bands provides a precise view of market sentiment and momentum.
Whether you're a beginner or an advanced trader, the TDI delivers clean signals that can easily be incorporated into any forex trading strategy.
FAQ
1 Download
Published:
Nov 26, 2025 02:21 AM
Category: