In the financial markets, trading volume generally refers to the number of contracts, shares, or lots traded during a specific time period. However, in forex, traders must distinguish between two types of volume:
Real Volume
Real volume data comes from centralized exchanges, such as the NYSE. For example, reading the volume indicator on the NYSE reveals how many shares of a particular company were bought or sold.
Tick Volume
The forex market is decentralized, meaning it does not operate through one centralized exchange. Instead, it functions as a global interbank market. Since real volume is not available, forex brokers provide tick volume, which measures how many times the price changes within a specific period.
While tick volume does not show the exact number of contracts traded, it is still highly valuable because it reflects market activity, and numerous studies have shown a strong correlation between tick volume and real volume.
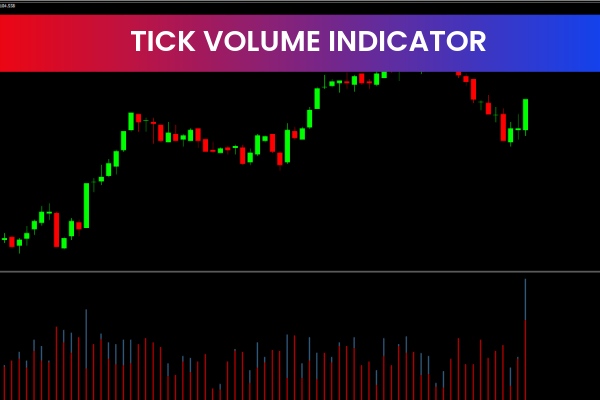
What Is the Volume Indicator in MT4?
The standard MT4 volume indicator displays tick volume supplied by your broker. Each bar represents the number of price changes within that candle. Although it does not show true exchange-based volume, it remains a powerful tool for assessing trader participation, price strength, and potential reversals.
Tick Volume vs. Real Volume – Which Is Better?
Both volume types offer meaningful insights:
Tick Volume:
Shows how active the market is. More price movements = more trader participation.
Real Volume:
Shows the exact number of contracts or shares traded. More precise but unavailable in spot forex.
In practice, both reflect trader interest and market activity. Many professional traders successfully use tick volume to understand Supply And Demand dynamics in forex.
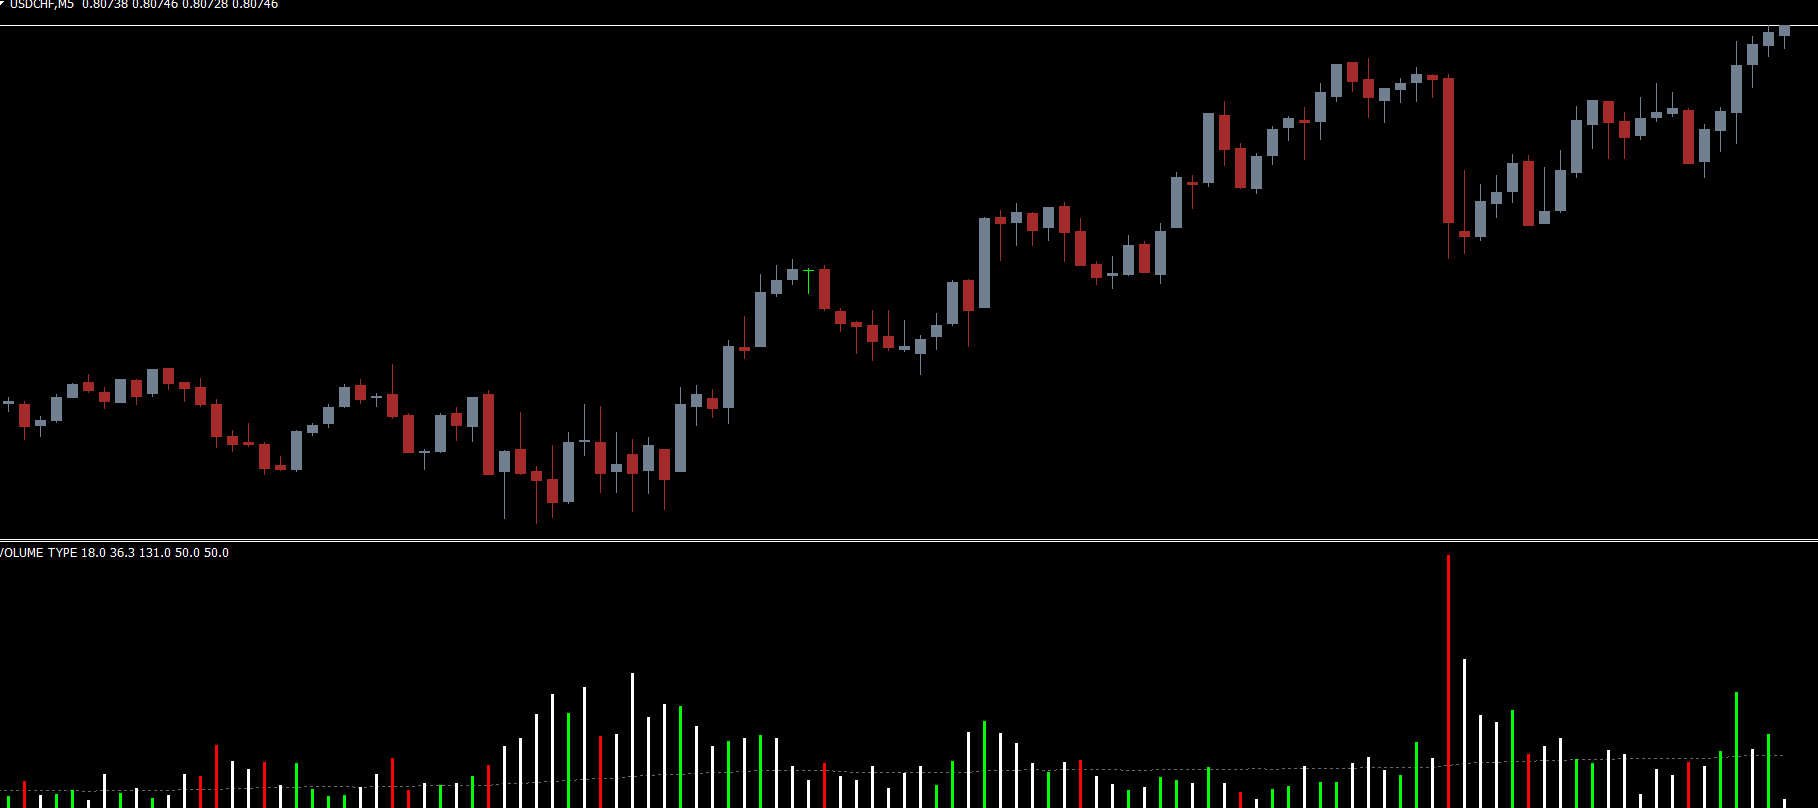
How to Use the HawkEye Volume Indicator
The HawkEye Volume Indicator automatically analyzes price movement to identify bullish and bearish pressure:
Green Bar:
The price opened near the lows and closed near the highs → bullish momentum.
Red Bar:
The price opened near the highs and closed near the lows → bearish momentum.
However, beginners should note that the volume indicator does not provide direct BUY or SELL signals. Instead, it highlights market strength, making it ideal for confirming trends, identifying exhaustion, or spotting accumulation and distribution zones.
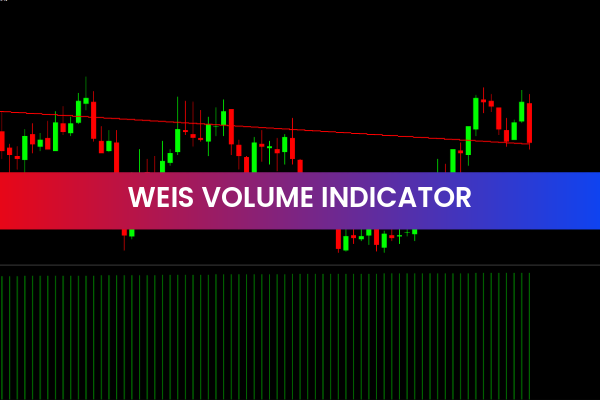
Example: Bullish Market Setup
In the chart example:
Arrow 1 shows a steady decline in price.
Arrow 2 shows volume increasing above the moving average line, indicating strong selling activity.
This confirms bearish pressure, supporting the formation of the resistance zone (marked in red).
Later, when the price retested this zone, the downward trend resumed.
This example shows how volume analysis validates support/resistance zones and reveals trader behavior behind price movements.
Advantages of the HawkEye Volume Indicator
Works on forex, crypto, stocks, and commodities
Does not repaint
Can be paired with oscillators, trend indicators, or S/R analysis
Useful for swing traders and long-term investors
Helps identify real supply/demand shifts
Disadvantages
Volume analysis requires practice and experience
The indicator does not include alert notifications
Does not provide direct BUY/SELL entries—only context
Final Thoughts
The HawkEye Volume Indicator for MT4 is ideal for traders who want to incorporate volume analysis into their strategy. Understanding volume helps you read market sentiment, identify strong trends, and trade in harmony with the dominant market force. Traders aiming for long-term success should invest time in learning volume-based techniques.
Before trading with real money, always practice using the HawkEye Volume Indicator on a demo account to build confidence and accuracy.
FAQ
4 Downloads
Published:
Nov 21, 2025 09:19 AM
Category: