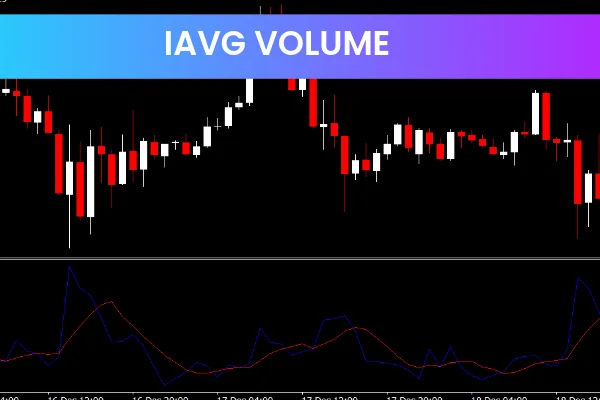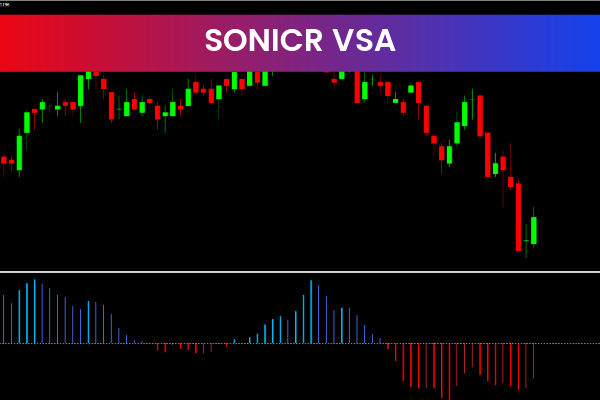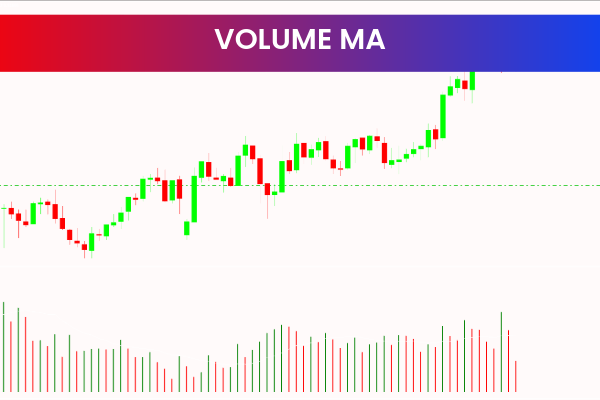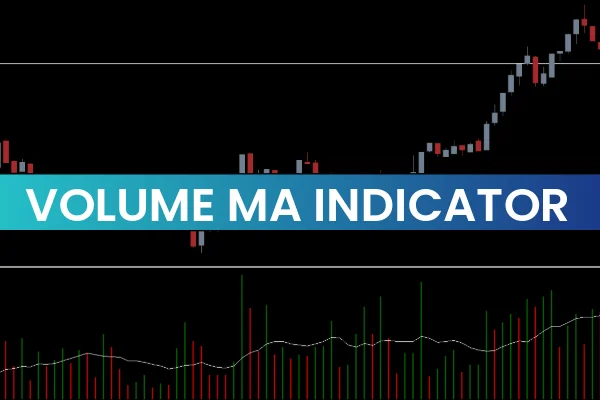
The Volume MA Indicator for MT4 is a straightforward but powerful technical tool designed to help forex traders identify trend direction, momentum strength, and potential market reversals. It works by applying a Simple Moving Average (SMA) to the volume data and then displaying the trend as red (bearish) and green (bullish) bars. Because the SMA is one of the most reliable forms of Moving Average used in technical analysis, traders can easily interpret market sentiment at a glance.
This indicator is especially useful for beginners who want confirmation of Price Action, as well as advanced traders who use volume-based strategies.
How the Volume MA Indicator Works
The indicator consists of two key components:
Colored Volume Bars
The main display shows red bars and green bars, which represent bearish and bullish sentiment respectively:
Green bars – indicate rising volume aligned with bullish momentum.
Red bars – signal decreasing or reversing volume associated with bearish pressure.
These bars appear in a separate window below the price chart, making it easier to monitor Trend Strength visually.
SMA Signal Line
Along with the bars, the indicator plots an SMA line that helps smooth volume data and provides a baseline for understanding the current trend. When bars are consistently above the SMA line and showing green, the market is likely in an upward trend. Conversely, red bars under the SMA suggest a downward trend.
The simplicity of the signal line makes this indicator user-friendly and effective in real-time analysis.
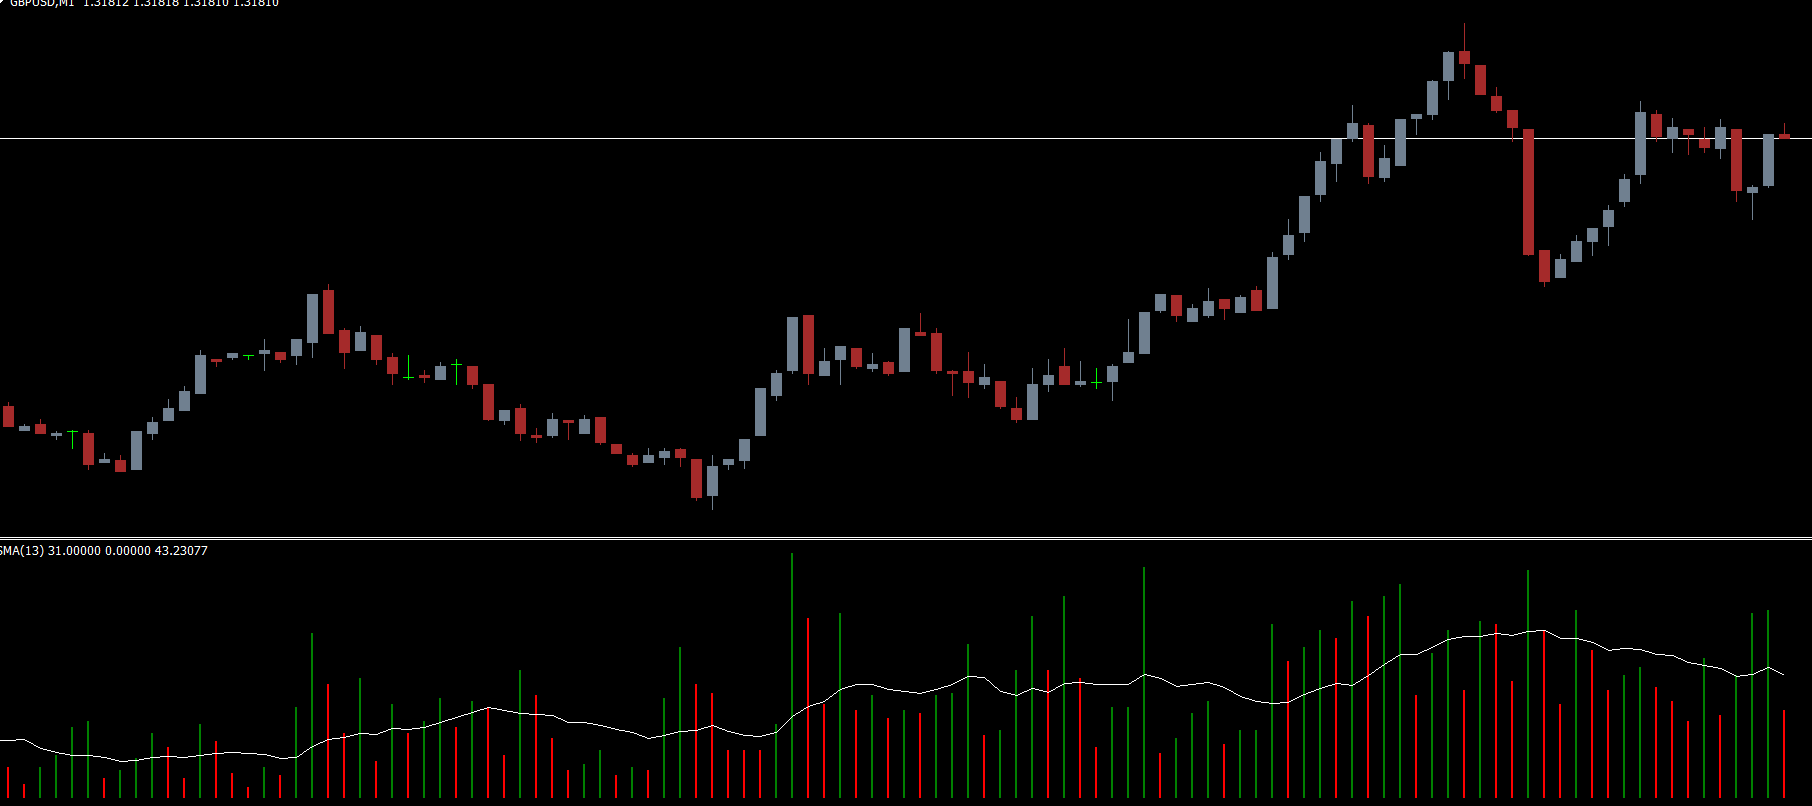
Volume MA Indicator BUY and SELL Signals
The indicator generates clear BUY and SELL conditions, helping traders execute trades with confidence.
BUY Signal
A BUY signal occurs when:
The bars turn green, showing bullish volume.
Bars begin moving above the SMA line.
This signals strong buying interest, and traders can consider opening long positions.
SELL Signal
A SELL signal occurs when:
The bars turn red, indicating bearish volume.
Bars drop below the SMA line.
This suggests that sellers are taking control of the market.
The GBP/USD H4 chart example typically shows how easily traders can spot a shift from red to green or vice versa, enabling timely entries and exits.
Using the Indicator for Reversal Detection
One of the biggest advantages of the Volume MA Indicator for MT4 is its ability to highlight market reversal points. When the bar color changes—from red to green or green to red—it often signals a shift in momentum.
Traders can:
Exit long trades when bars start turning red
Exit short trades when bars turn green
Use these color changes alongside other indicators to confirm reversal points
This makes it ideal for scalpers, swing traders, and even day traders.
Combining the Volume MA Indicator with Other Tools
While effective on its own, the indicator becomes even more powerful when paired with additional technical tools. Many traders combine it with:
Relative Strength Index (RSI)
Moving Average Convergence Divergence (MACD)
Support And Resistance zones
Price action patterns
RSI can help confirm overbought or oversold conditions, while MACD can validate trend momentum. This multi-layered approach can significantly increase trading accuracy.
Why Use the Volume MA Indicator?
Here are some of its key benefits:
Easy to interpret for both beginners and experienced traders
Works on all forex pairs and MT4 timeframes
Helps identify trends, reversals, and momentum
Offers clear visual cues via color changes
Provides early warning before price action changes
Conclusion
The Volume MA Indicator for MT4 is a highly effective tool for identifying trend direction using volume analysis and SMA smoothing. Whether you trade breakouts, reversals, or pure trend-following strategies, this indicator provides clear BUY and SELL cues.
You can download the Volume MA Indicator for free at IndicatorForest.com, along with hundreds of other forex indicators to enhance your trading strategy.
FAQ
1 Download
Published:
Nov 25, 2025 21:08 PM
Category: