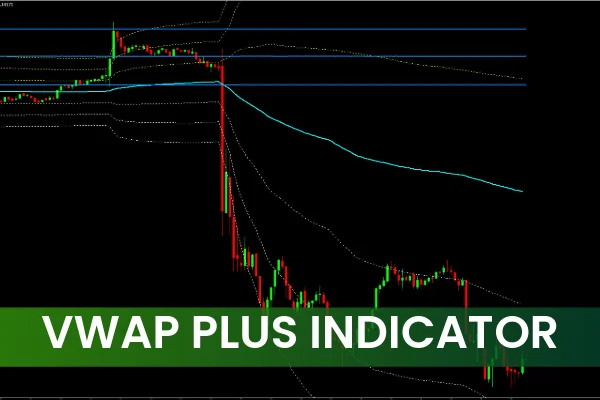
The VWAP Plus Indicator for MT4 is a volume-weighted trading tool that uses the Volume Weighted Average Price (VWAP) as its core signal. Unlike standard moving averages, the VWAP incorporates traded volume, giving traders a more accurate and meaningful view of price equilibrium.
Beyond the core VWAP line, the indicator also plots dynamic Support And Resistance zones—a major advantage for intraday traders looking to capture precise reversals and trend shifts.
If you prefer alternative VWAP-based tools, we also recommend exploring the VWAP Bands Indicator and the New VWAP Indicator, which offer different approaches to volume-weighted analysis.
Why Traders Prefer the VWAP Plus Indicator
One standout feature is the AQUA-colored VWAP line, which visually separates itself from Price Action without cluttering the chart. Price closing above the VWAP gives an immediate bullish bias, while closing below it signals bearish conditions.
In my own trading, the dynamic support and resistance zones proved extremely reliable, especially on M5 and M15 charts. Combining VWAP rejections with candlestick confirmation helped me avoid multiple false entries during choppy sessions.
The indicator is suitable for:
New traders using VWAP for simple trend identification
Advanced traders combining VWAP with price action or volume analysis
Intraday, swing, and even long-term traders (M5 → Monthly charts)
Its strongest performance occurs on lower timeframes, where VWAP reacts quickly to changing market conditions.
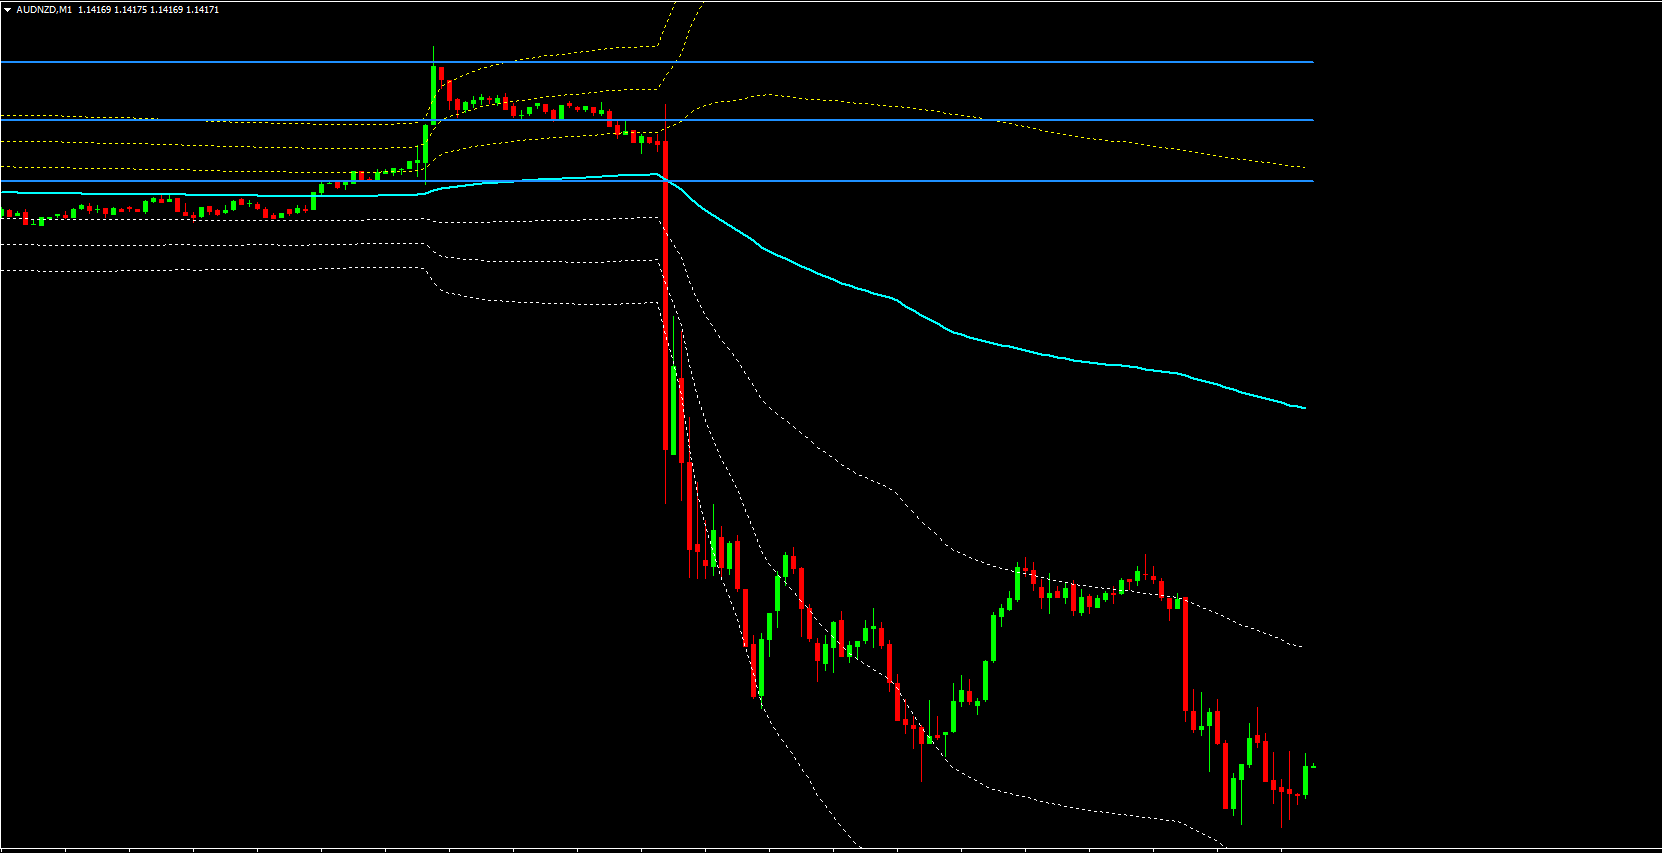
VWAP Plus Indicator MT4 – VWAP Trading Signals
The EUR/USD H1 chart example shows the indicator in action:
The AQUA line represents VWAP
YELLOW lines act as resistance
WHITE lines act as support
BUY Signal
A bullish signal occurs when price crosses above and closes above the AQUA VWAP line.
Stop Loss: previous swing low
Take Profit: yellow resistance lines
SELL Signal
A bearish signal appears when price crosses below the VWAP line.
Stop Loss: previous swing high
Take Profit: white support lines
Traders can combine these signals with candlestick patterns for added confluence.
VWAP Plus Indicator MT4 – Dynamic Support & Resistance Signals
The EUR/JPY M5 chart example shows how VWAP-derived dynamic zones work. These BLUE horizontal lines mark key reaction points where price often reverses.
Support Rejection → BUY
If price touches a BLUE support line and forms a rejection pattern, it indicates a bullish reversal.
Stop Loss: previous swing low
Resistance Rejection → SELL
If price reacts negatively to a resistance line, it signals a bearish entry.
Stop Loss: previous swing high
These levels perform exceptionally well on M5–M15 during active market hours.
Pros and Cons of the VWAP Plus Indicator
Pros
Clear volume-weighted trend signals
High-probability dynamic S/R zones
Beginner-friendly color coding
Excellent for intraday and Scalping strategies
Effective across forex, indices, stocks, crypto
Cons
Can produce false signals during highly volatile news events
Requires confirmation with price action or momentum tools
Less reactive on higher timeframes (Weekly/Monthly)
Conclusion
The VWAP Plus Indicator for MT4 delivers robust volume-weighted trading signals through its VWAP core line and dynamic support/resistance zones. It is suitable for traders of all skill levels but works best when combined with price action confirmation.
From my experience, this indicator becomes even more powerful when paired with volatility-based tools. To explore this further, check out our guide: How to Use Bollinger Bands in Forex Trading.
The indicator is free, simple to install, and a valuable addition to any MT4 trading system.
FAQ
11 Downloads
Published:
Nov 25, 2025 21:27 PM
Category: