Unlock Institutional Market Geometry with the Fibonacci Grid Indicator for MT4
In the modern trading environment, technical analysis is no longer just about identifying simple Support And Resistance levels. Institutional algorithms operate on the principle of geometric confluence—where time, price, and mathematical ratios intersect. The Fibonacci Grid Indicator for MetaTrader 4 (MT4) is a professional-grade technical solution designed to map these intersections automatically. By projecting a multi-layered grid based on the sacred golden ratio, this indicator allows traders to visualize the hidden architecture of the market and identify high-probability "kill zones" for entries and exits.
The Power of Automated Fibonacci Confluence
Traditional Fibonacci retracement tools require manual placement, which often leads to subjective bias and inconsistent results. The Fibonacci Grid Indicator removes the guesswork by dynamically anchoring itself to significant structural swings. It creates a comprehensive "web" of price levels that act as a roadmap for market delivery.
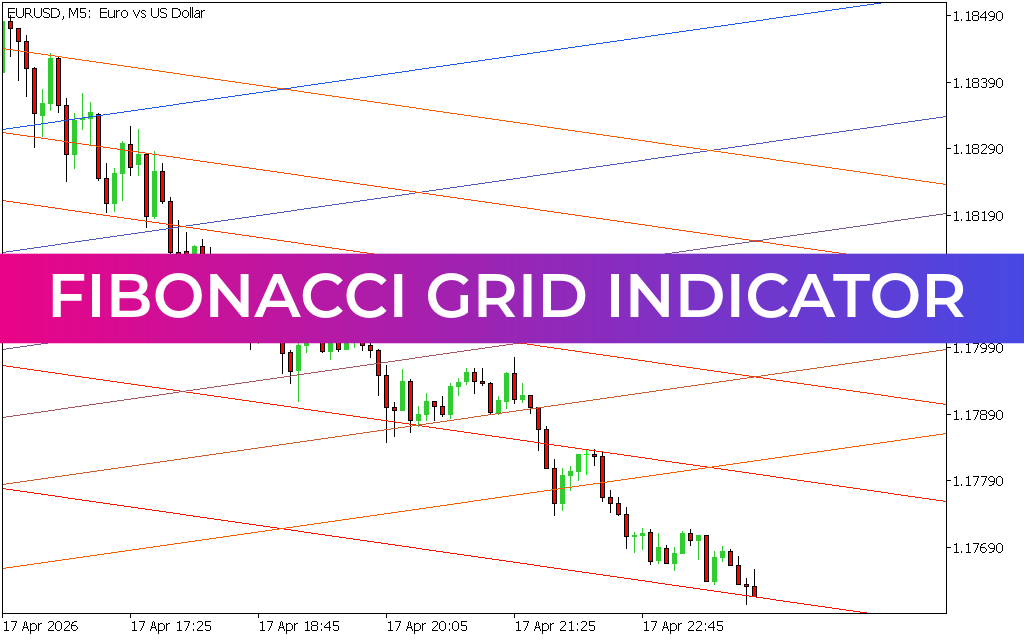
As observed in technical analysis on pair structures like AUD/CAD and EUR/USD across various timeframes, the Fibonacci Grid system provides several definitive operational advantages:
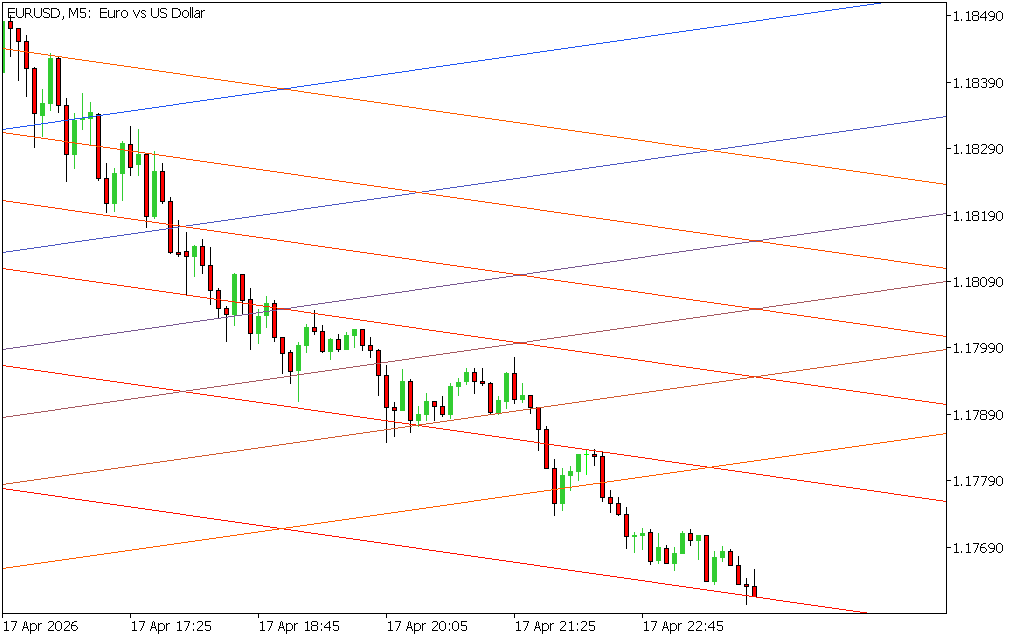
- Dynamic Structural Anchoring: The indicator automatically identifies major swing highs and lows, projecting the grid across the relevant Price Action. As seen on recent M5 charts, the grid adjusts as new structural pivots are formed, ensuring your analysis remains current with the live market flow.
- Precision Fibonacci Levels: The grid includes all critical institutional levels, including the 23.6%, 38.2%, 50.0%, 61.8% (Golden Ratio), and 76.4% levels. These lines serve as psychological barriers where price is mathematically predisposed to react.
- Visualizing Market "Squeezes": When price action begins to narrow within the grid's boundaries, it indicates a period of accumulation or distribution. A breakout through the grid levels often signals the start of a massive trend expansion.
- Time and Price Integration: Unlike standard one-dimensional tools, the grid provides a two-dimensional perspective. Traders can see how price interacts with specific Fibonacci ratios over time, allowing for more precise forecasting of potential reversal windows.
Strategic Implementation for Systematic Traders
The Fibonacci Grid Indicator is a versatile asset that enhances a wide array of strategies, from classic swing trading to complex ICT-based institutional setups.
- Deep Retracement Entries: In a confirmed uptrend, look for price to pull back into the "Golden Zone" between the 61.8% and 76.4% grid lines. If price shows rejection candles at these mathematical boundaries, it provides a high-reward entry point to join the dominant trend.
- Target Projection and Take Profit: The Fibonacci Grid doesn't just show where to enter; it shows where the move is likely to end. Use the extension levels within the grid to set objective profit targets that align with institutional liquidity pools.
- Confluence with Price Action: The most powerful signals occur when a Fibonacci Grid level aligns perfectly with a historical support/resistance zone or a "Fair Value Gap." This alignment creates a "high-conviction" zone where institutional orders are likely to be clustered.
Conclusion
The Fibonacci Grid Indicator for MT4 is a definitive solution for traders who demand mathematical precision and structural clarity. By bridging the gap between sacred geometry and modern price action, it empowers you to navigate the financial markets with institutional-grade confidence. Elevate your technical analysis today and master the geometry of the markets with the Fibonacci Grid system.
6 Downloads
Last Update:
Apr 18, 2026 13:04 PM
Published:
Feb 06, 2026 18:06 PM
Category: