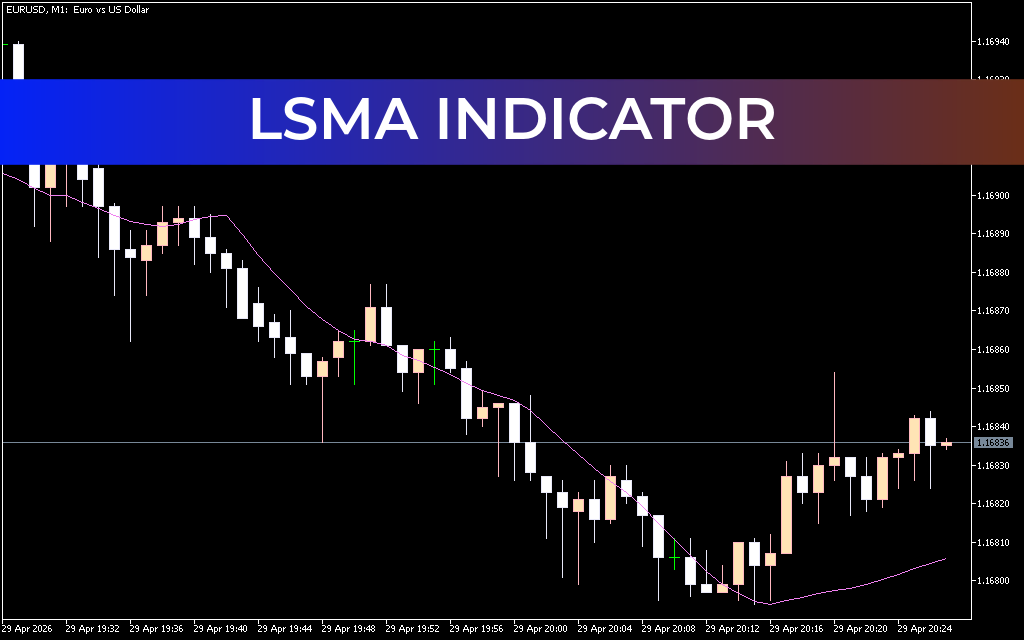
Precision Trend Tracking with the LSMA Indicator
In technical analysis, most moving averages suffer from a common enemy: lag. The Least Squares Moving Average (LSMA) is a sophisticated mathematical tool designed to combat this issue. By using a linear regression model to predict where the price should be, the LSMA provides a more responsive and "predictive" feel than a standard simple or exponential moving average.
What is the LSMA Indicator?
The LSMA (Least Squares Moving Average) is also frequently referred to as the Linear Regression Moving Average. Unlike a Simple Moving Average (SMA), which calculates the average price over a set period, the LSMA uses the "least squares" method to find the line of best fit through the price points of that period.
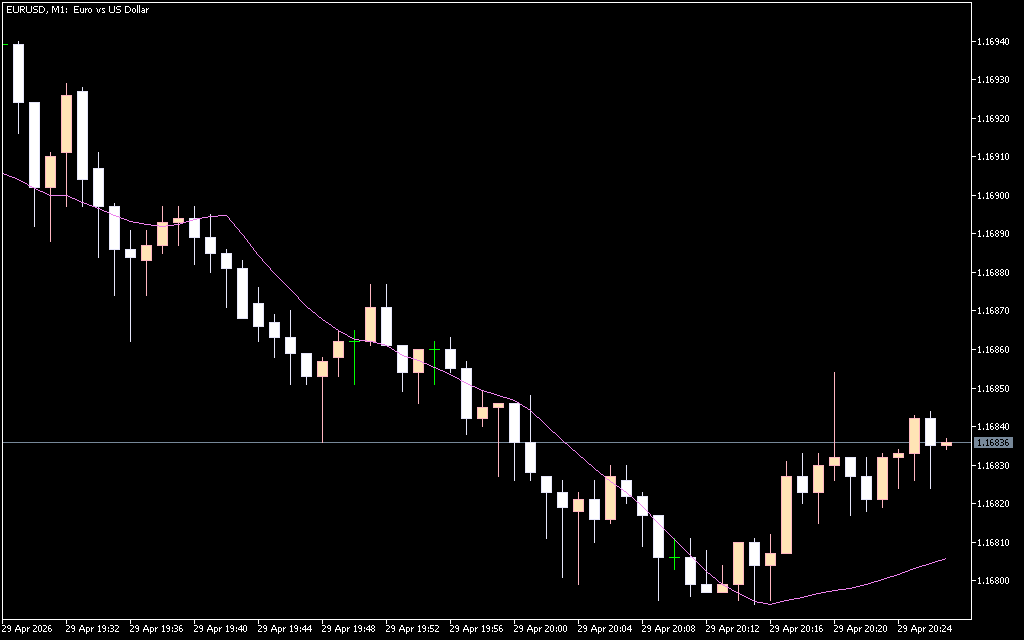
Essentially, the indicator calculates a linear regression line for the specified period and then plots the end point of that line. Because it projects the current trend based on the slope of Price Action, it stays much closer to the current candlesticks during sharp moves, helping traders identify trend shifts the moment they begin.
Key Features of the LSMA
- Minimized Lag: Because it is based on a line of best fit rather than a simple average, it reacts to price changes much faster than an SMA or EMA of the same period.
- Trend Directionality: The slope of the LSMA is a powerful indicator in itself. An upward-sloping LSMA indicates a strong bullish trend, while a downward slope confirms bearish control.
- Price Crossover Signals: When the price crosses the LSMA line, it is often seen as a signal of a change in short-term momentum.
- Versatility: It is highly effective for both Scalping (on M1/M5 charts) and swing trading (on H4/D1 charts) because of its ability to filter out minor market noise while remaining sensitive to real moves.
Trading Strategy: How to Use LSMA Effectively
The LSMA is a favorite among price action traders who want a cleaner chart. Here are the most effective ways to trade it:
- The LSMA Crossover: Buy when the price closes above the LSMA and sell when it closes below. Because the LSMA is so responsive, these crossovers often happen much earlier than they would with a 20-period SMA.
- Trend Filtering: Use a longer-period LSMA (e.g., 50 or 100) to determine the "bias." Only look for long setups if the price is above the LSMA and the line is pointing upward.
- Support And Resistance: In a strong trend, the LSMA often acts as a dynamic level of support or resistance. During a pullback, look for the price to touch the LSMA and "bounce" back in the direction of the trend.
- Combining with Oscillators: Pair the LSMA with a Momentum Indicator like the RSI. If the RSI shows oversold conditions and the price crosses above the LSMA, you have a high-confluence "Buy" signal.
Why Choose LSMA Over Traditional Averages?
Traders choose the LSMA when they want the smoothing effect of a moving average without the frustrating delay. If you find yourself entering trades too late because you're waiting for an SMA crossover, the LSMA provides the mathematical edge needed to catch the move closer to its origin.
7 Downloads
Last Update:
Apr 29, 2026 22:29 PM
Published:
Oct 24, 2025 22:51 PM
Category: